
NIL Technical Analysis
Looking at the NIL chart on a daily timeframe, it can be seen that the price has stuck within a triangle formation and there stand key support and resistance levels where the price might get a reaction.
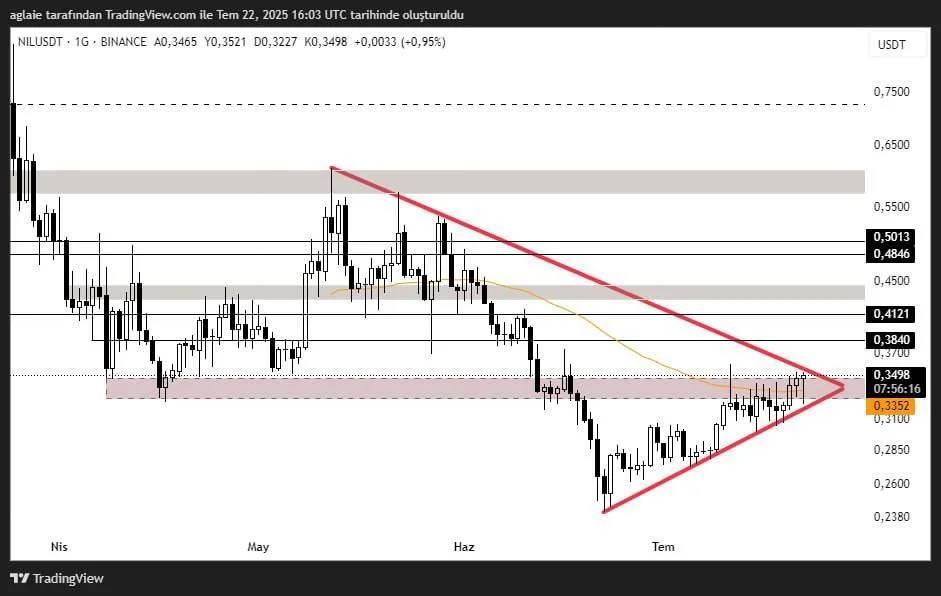
The first support to follow is $0.3352 in case of a pullback. This price level coincides with the lower border of the triangle pattern and it is crucial for the formation to continue. If this price level gets broken downwards, we can see a drop to the strong buy level of $0.3100, where the price recovered many times before.
In a positive scenario, the first resistance level the price will test is around $0.3840, which stands for the upper border of the triangle formation; therefore, it should be regarded as a key level for a potential breakout. If the price can see daily closing above the level of $0.3840, this can be considered as a confirmation of the upward breakout. We could see a test to the level of $0.4120 if the price can exceed $0.3840. If the momentum continues, the price range of $0.48–$0.50 could be targeted, as this area is both a psychological threshold and a place where sharp sell pressure was seen in the past.
These analyses, not offering any kind of investment advice, focus on support and resistance levels considered to offer trading opportunities in the short and medium term according to the market conditions. However, traders are responsible for their own actions and risk management. Moreover, it is highly recommended to use stop loss (SL) during trades.


