
LTC Short-Term Technical Analysis
When analyzing the LTC chart, we see that there is a falling wedge pattern forming in the short term. As we all know from experience, such patterns generally end up breaking above. LTC is currently trading at around $105, stuck near the upper border of the formation.
If we see a clear breakout above the upper border of the falling wedge formation, the technical formation target is moved upwards by the height of the wedge, which, in this case, makes the range $118.77–$120.00 a possible target.
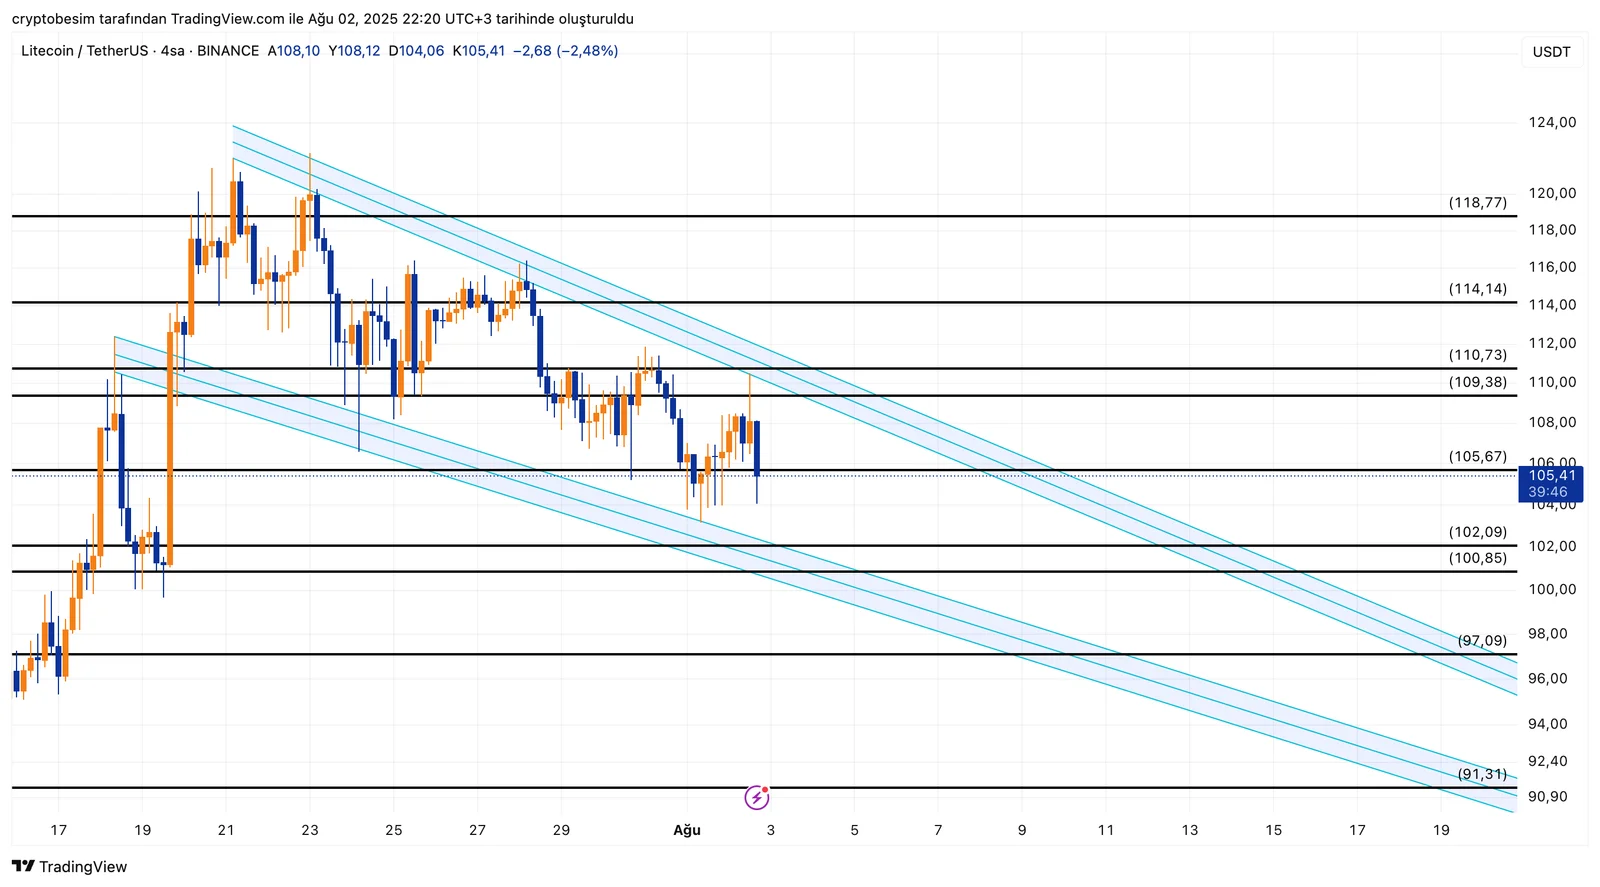
- Resistance levels to follow:• $109.38• $110.73• $114.14• $118.77–$120.00 (formation target)
- In case the price breaks downwards, support levels to follow are:• $102.09• $97.09• $91.31 (key support level)
These analyses, not offering any kind of investment advice, focus on support and resistance levels considered to offer trading opportunities in the short and medium term according to the market conditions. However, traders are responsible for their own actions and risk management. Moreover, it is highly recommended to use stop loss (SL) during trades.


