
LDO Technical Analysis
In the LDO chart, since the beginning of February, a downtrend that has been coming greets us. Recently, we can say that a symmetrical triangle formation has emerged with the trend structure it has created with higher lows. LDO is stuck in a tight price area. A target can be set based on liquidations through the breakout direction.
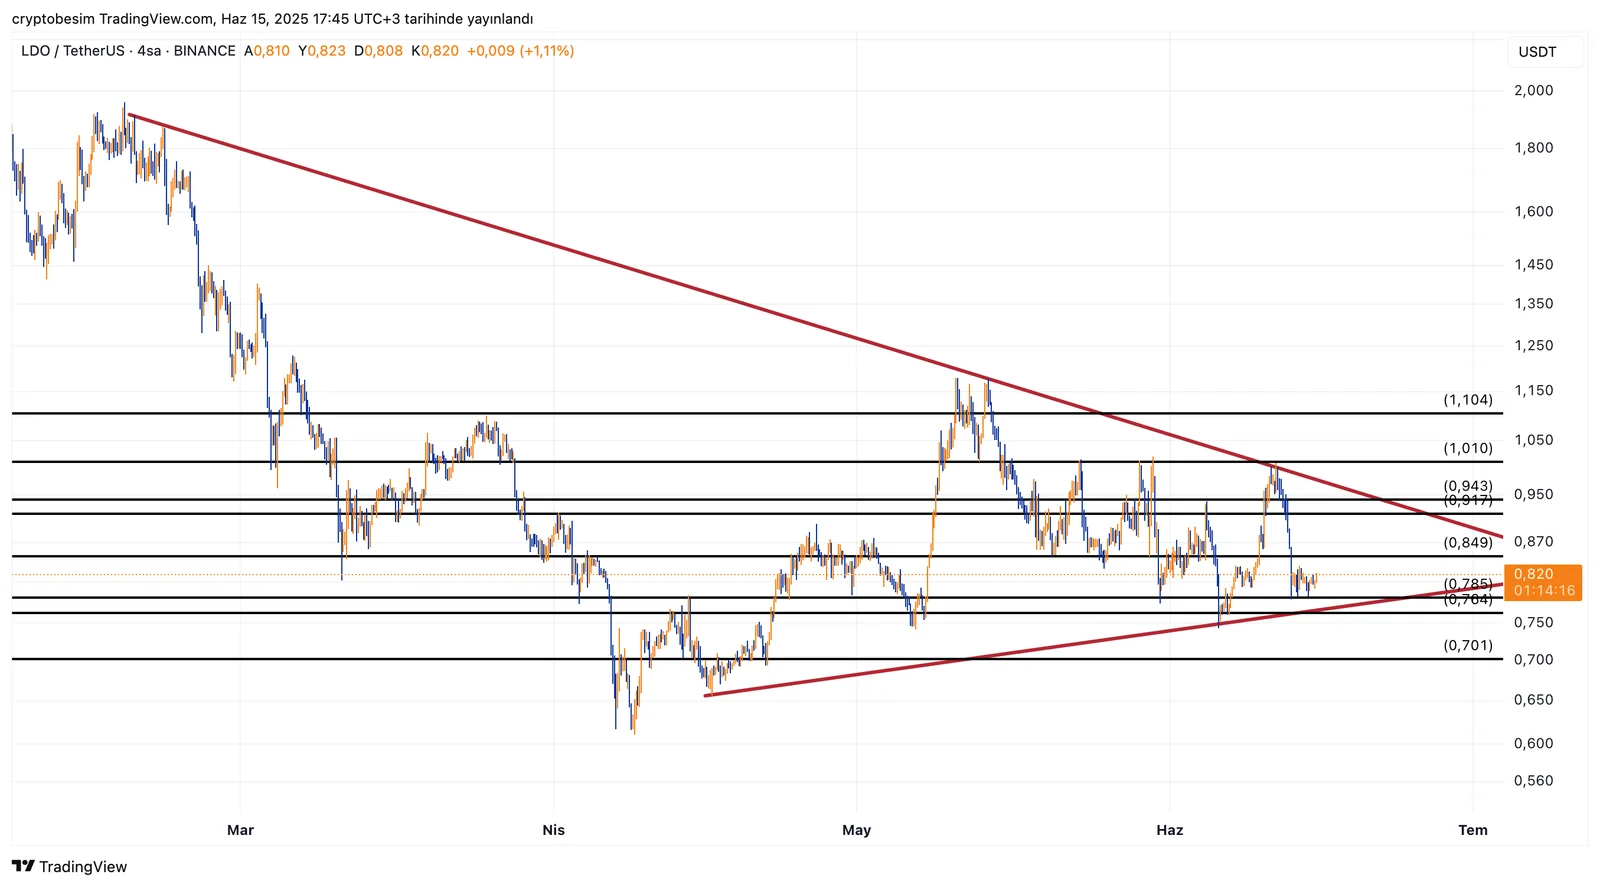
The $0.78–$0.76 support area, where LDO is priced into, seems to be a support area that is also an important buyer zone. On average, the trend support—in other words, the lower band of the symmetrical triangle—is at $0.76. In a downward breakout, first the $0.70 level, and then the $0.60 area where there are intense liquidations, can be considered as a downward target.
For an upward breakout, we can see the $0.92–$0.94 price area as both horizontal resistance and the upper trend resistance of the symmetrical triangle. After the breakout, the $1–$1.10 and $1.23 levels can be followed one by one.
These analyses, which do not provide investment advice, focus on support and resistance levels that are thought to create trading opportunities in the short and medium term according to market conditions. However, the user is solely responsible for trading and risk management. In addition, it is strongly recommended to use stop-loss in relation to shared transactions.


