
LDO/USDT Technical Analysis
Looking at the LDO chart, we can clearly see that a downtrend is obvious. The price tested the strong resistance range between the levels at $1.25 – $1.31, which work as both horizontal resistance and the upper border of the triangle pattern. Therefore, it should be considered as normal if the price sees some sell pressure here in terms of technical perspective.
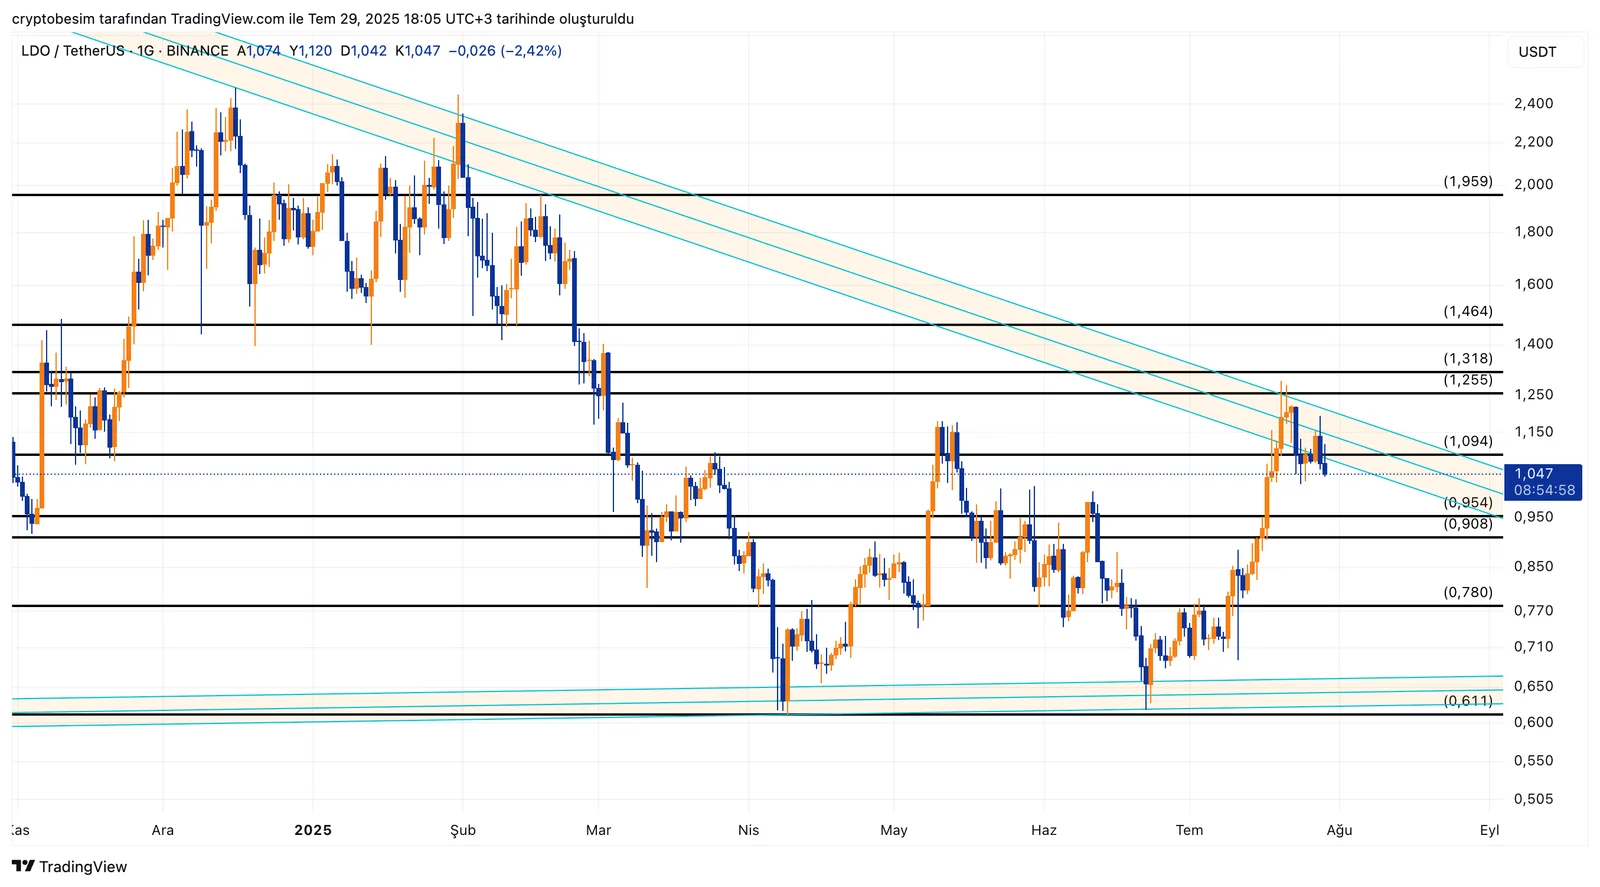
LDO is currently trading at around the level of $1.047. The range between the levels at $0.90 and $0.95 seems to be the support area we should be following in the event of a continued pullback. This price range has worked as a significant demand area in the past, and it is highly possible that the price will move back towards the upper border of the triangle with the reaction it receives from here.If the price gains momentum from this support zone and goes up to break out of the triangle pattern, we should be following the resistance levels at $1.318, $1.464, and $1.959 respectively.In case of a downward scenario, we can say that closings below the level of $0.90 could activate the lower support levels at $0.78 → $0.70 → $0.611.
These analyses, not offering any kind of investment advice, focus on support and resistance levels considered to offer trading opportunities in the short and medium term according to the market conditions. However, traders are responsible for their own actions and risk management. Moreover, it is highly recommended to use stop loss (SL) during trades.


