
ID Technical Outlook
When we analyze the ID chart, we can clearly see that the long-standing descending channel pattern is still active. The price of the coin has tested the upper border of this channel for the fourth time, and again it was rejected from there. ID is currently trading at around $0.1564 in a downtrend.The price could not break the range between the levels at $0.1900 - $0.1984, as this range has served as a very strong resistance previously. Later, the price pulled back to the support level at $0.1664 and then to $0.1487 following the price rejection at the resistance. ID is testing the support currently.We could be talking about the lower border of the descending channel around the level at $0.1343 if ID loses the support level at $0.1487.ID needs to break above the level at $0.1664 and hold above it for an upward recovery. Still, the coin will be trading within the downtrend and there will be sell pressure there. The target of the formation could technically move to the range between the levels at $0.30 - $0.33 if the channel pattern breaks upward. Still, we need to see the price close above the level $0.1984 for this scenario to realize.
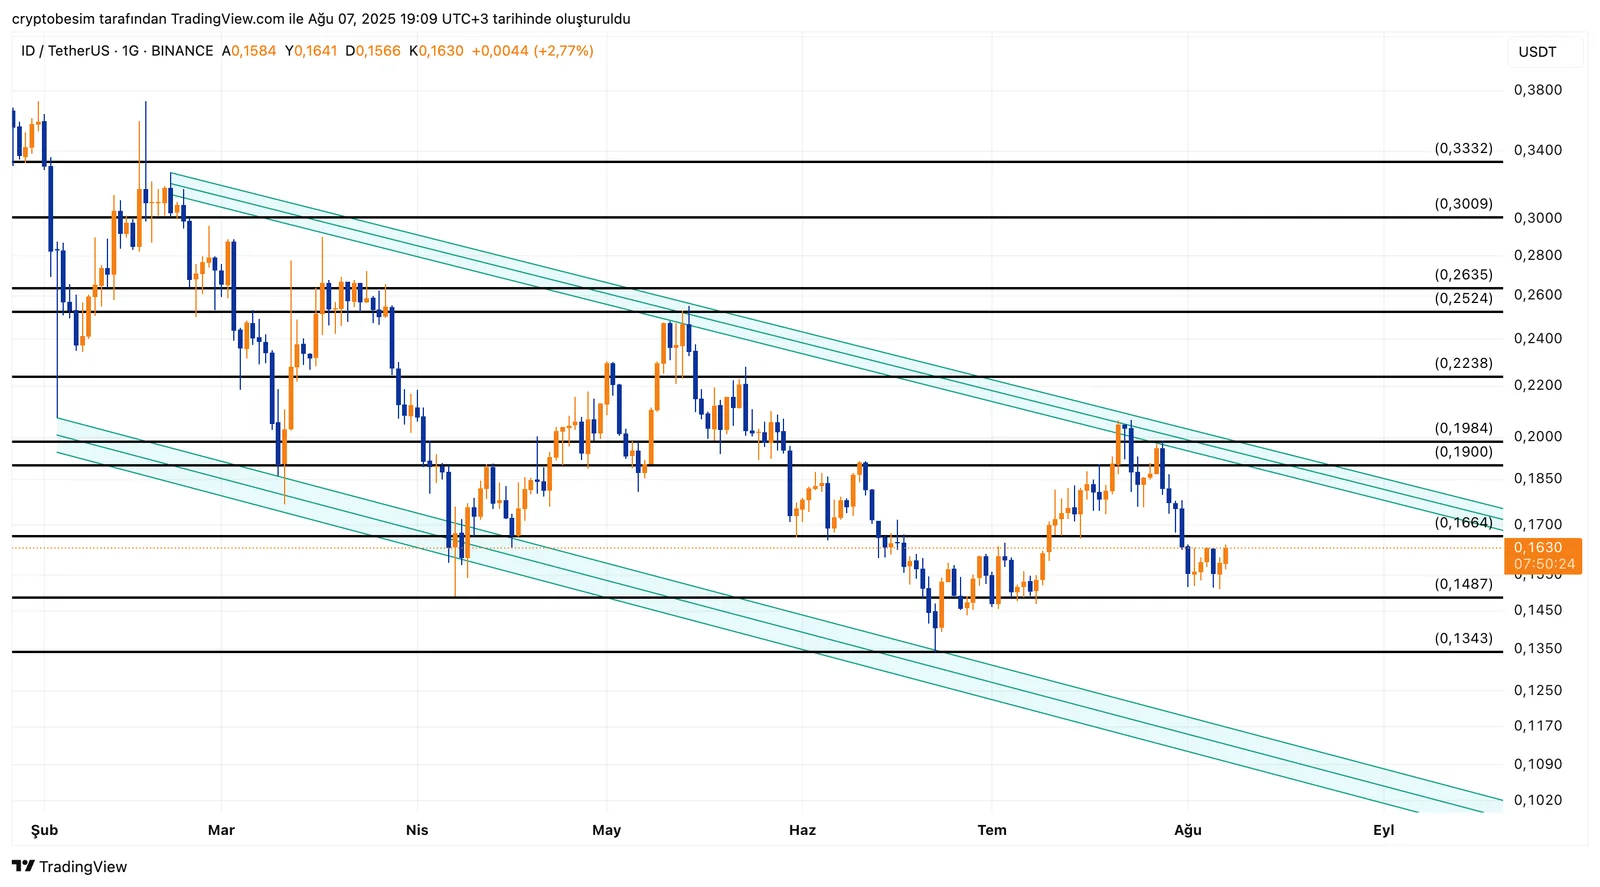
- Summary:• Price: $0.1564, downtrend continues within the channel• Last rejection: $0.1900 - $0.1984• Current support: $0.1487• If this level is broken, next support: $0.1343• Persistence above $0.1664 is needed for an upward recovery• If the channel breaks, target: $0.30 - $0.33
These analyses, not offering any kind of investment advice, focus on support and resistance levels considered to offer trading opportunities in the short and medium term according to the market conditions. However, traders are responsible for their own actions and risk management. Moreover, it is highly recommended to use stop loss (SL) during trades.


