
FIL Technical Analysis
Looking at the FIL chart, we can see that there is a double-bottom formation possibility or an inverse head-and-shoulders formation in case the price reacts from the upper band of the channel again. It is clear on the chart that the price of the coin has recovered from the level of $2.00–$2.20 many times before, as this price zone has acted as a strong support so far. In short, the price moving within the descending channel could be forming a new bottom in the lower band of the channel for the time being.
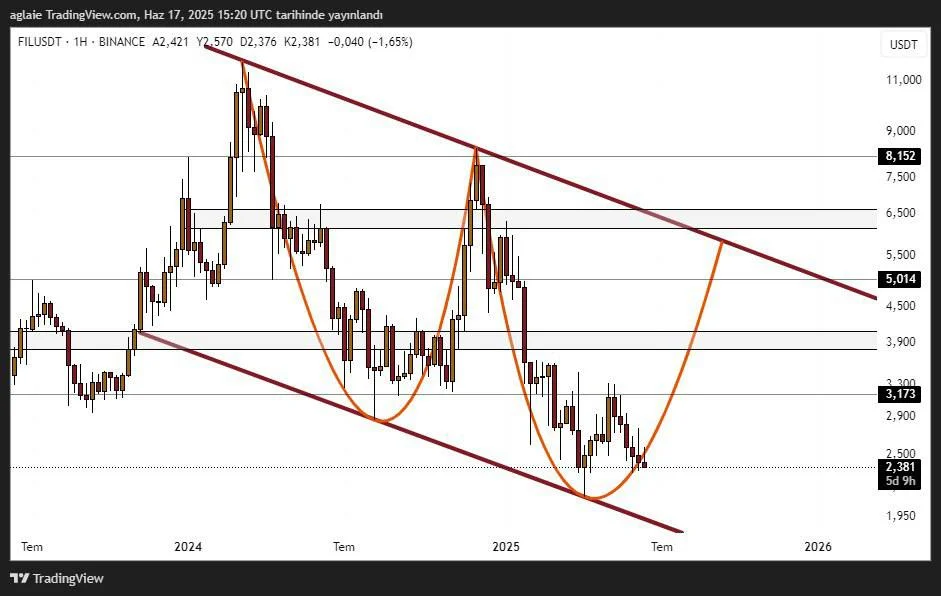
The chart displays quick ups and sharp pullbacks following previous major downs; however, the pattern forming in a similar bottom area could be signaling a reversal in the price. $3.17 could be an ideal target in case of upward movements, and if it is passed successfully, other mid-term targets like $5.00 and $8.15 are technically possible.
As seen on the chart, as long as the upper band of the channel, $5.00–$5.50 range, is not broken, it is highly improbable for the pattern to gain confirmation. If this price zone gets broken upwards, then the formation will be confirmed and major targets could be spoken of later.
To summarize, Fil coin is trading in a bottom area where buyers seem strong. If the formation continues, then we could see a major reversal in the price in the coming days.
These analyses, not offering any kind of investment advice, focus on support and resistance levels considered to offer trading opportunities in the short and medium term according to market conditions. However, the responsibility for making transactions and risk management belongs entirely to the user. In addition, it is strongly recommended to use stop loss (SL) in relation to shared transactions.


