
FET Technical Analysis
Looking at the FET daily chart, we can see a clear descending channel pattern which has worked properly since the beginning of 2024.
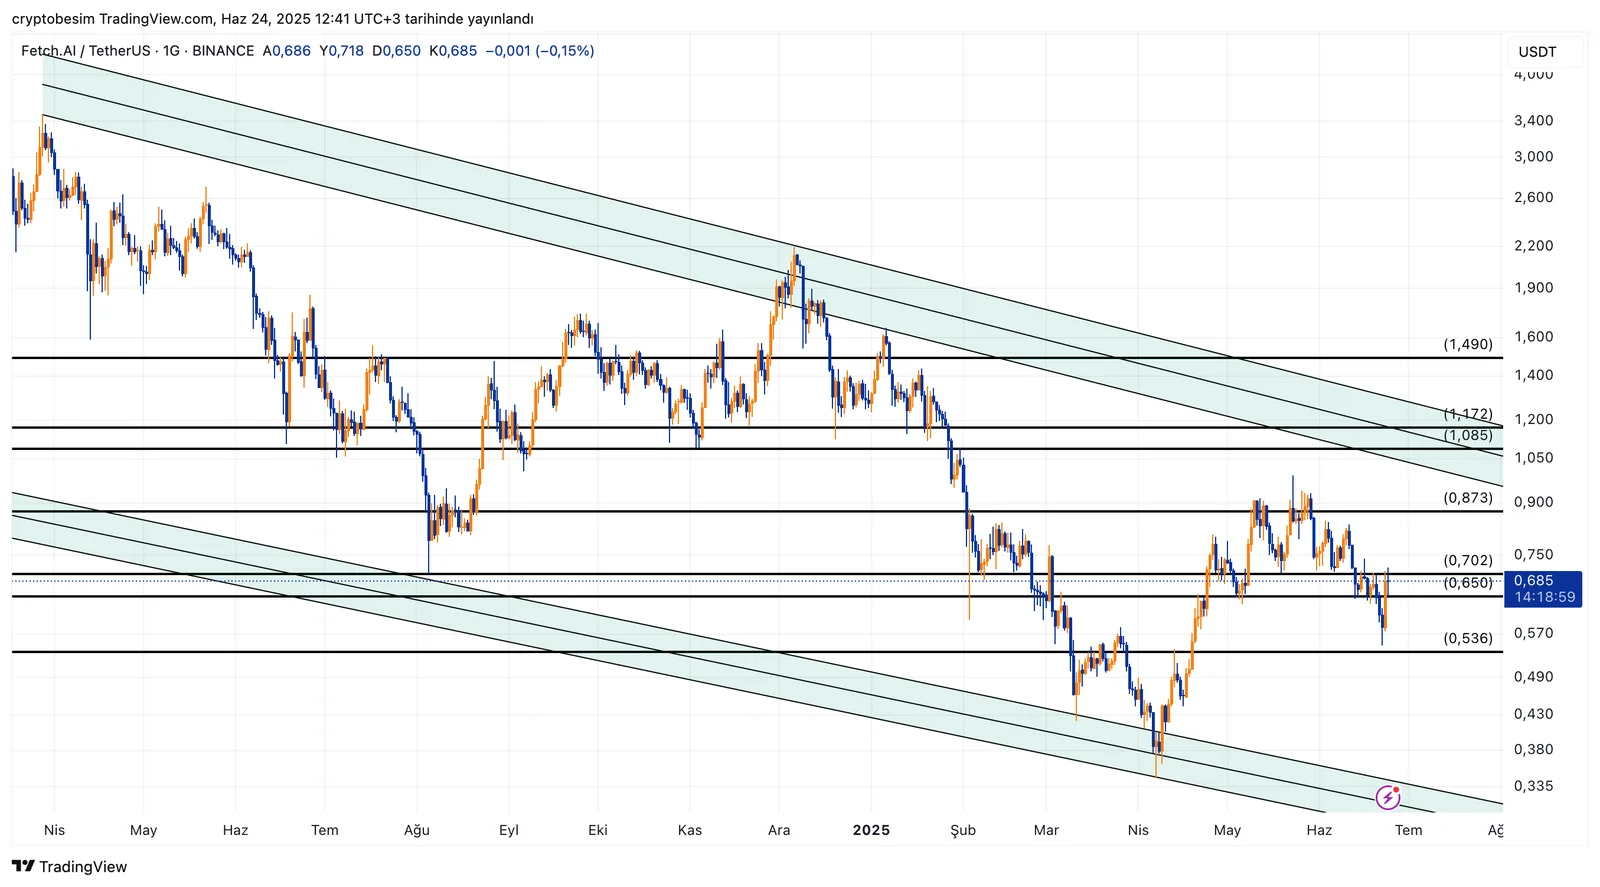
The price of the coin is currently trading in the middle band of this descending channel and we have a significant support zone around $0.65–$0.70. The price breaking down this important support zone is trading above the support area again. The price can go down first to the level of $0.53 in case of daily closing below the important level $0.65 and then it can retreat to the level of around $0.33 which is the channel trend support.
The level of $0.87 is only possible if the price closes above the level of $0.70 in terms of upward movements. Above this price level, we have the level $1 which is the trend resistance level. Technically, it is highly possible that a breakout will occur in case of next trend test.
These analyses, not offering any kind of investment advice, focus on support and resistance levels considered to offer trading opportunities in the short and medium term according to the market conditions. However, the user is responsible for their own actions and risk management. Moreover, it is highly recommended to use stop loss (SL) during the transactions.


