
FET Technical Analysis
Looking at the daily chart of FET/USDT, it is clear that there is a descending channel formation, which has perfectly worked up to this day since the beginning of 2024.
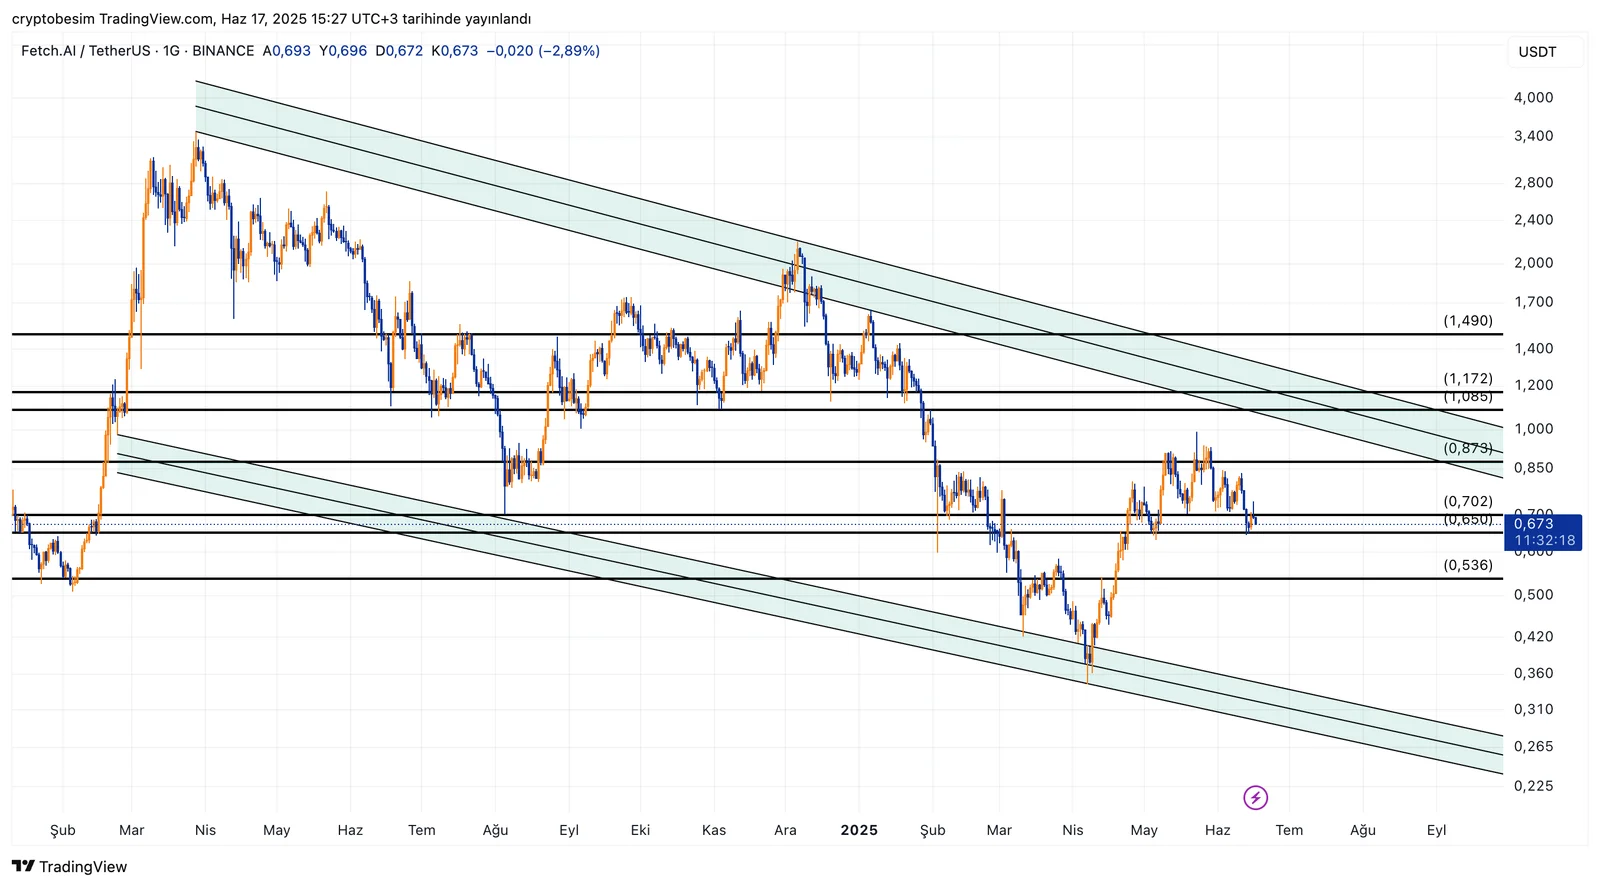
The price of the coin is now trading in the middle band of this channel, where the level of $0.65–$0.70 acts as a major support. The price has reacted from this support level earlier. If there come daily closures below this support level, $0.69, the price might first go down to $0.53 and then to the channel trend support level of $0.33.
In terms of upward movements, we first need to witness closures above $0.70 if we want to speak of the level $0.87, above which $1 — trend resistance level — may be the first target. Technically speaking, the next trend test will bring a breakout, which is highly probable.
These analyses, not offering any kind of investment advice, focus on support and resistance levels considered to offer trading opportunities in the short and medium term according to market conditions. However, the responsibility for making transactions and risk management belongs entirely to the user. In addition, it is strongly recommended to use stop loss (SL) in relation to shared transactions.


