
Ethereum – 4-Hour Chart Short-Term Technical Analysis (May 30, 2025)
Ethereum is moving within an ascending parallel channel. At the moment, it has touched the lower boundary of the channel at $2,540, which acts as a significant short-term support.
Key Technical Levels:
Supports:
- $2,540 (Channel lower boundary and horizontal support)
- $2,467
- $2,397
Resistances:
- $2,566 (Short-term horizontal resistance)
- $2,632
- $2,788 (Channel upper boundary)
Technical Pattern:
Ascending Channel: Price continues to move within the channel. The recent approach to the lower band increases the likelihood of a short-term bounce.
Horizontal Consolidation: There is a range-bound movement between $2,540 and $2,630. A breakout from this range will determine the short-term trend direction.
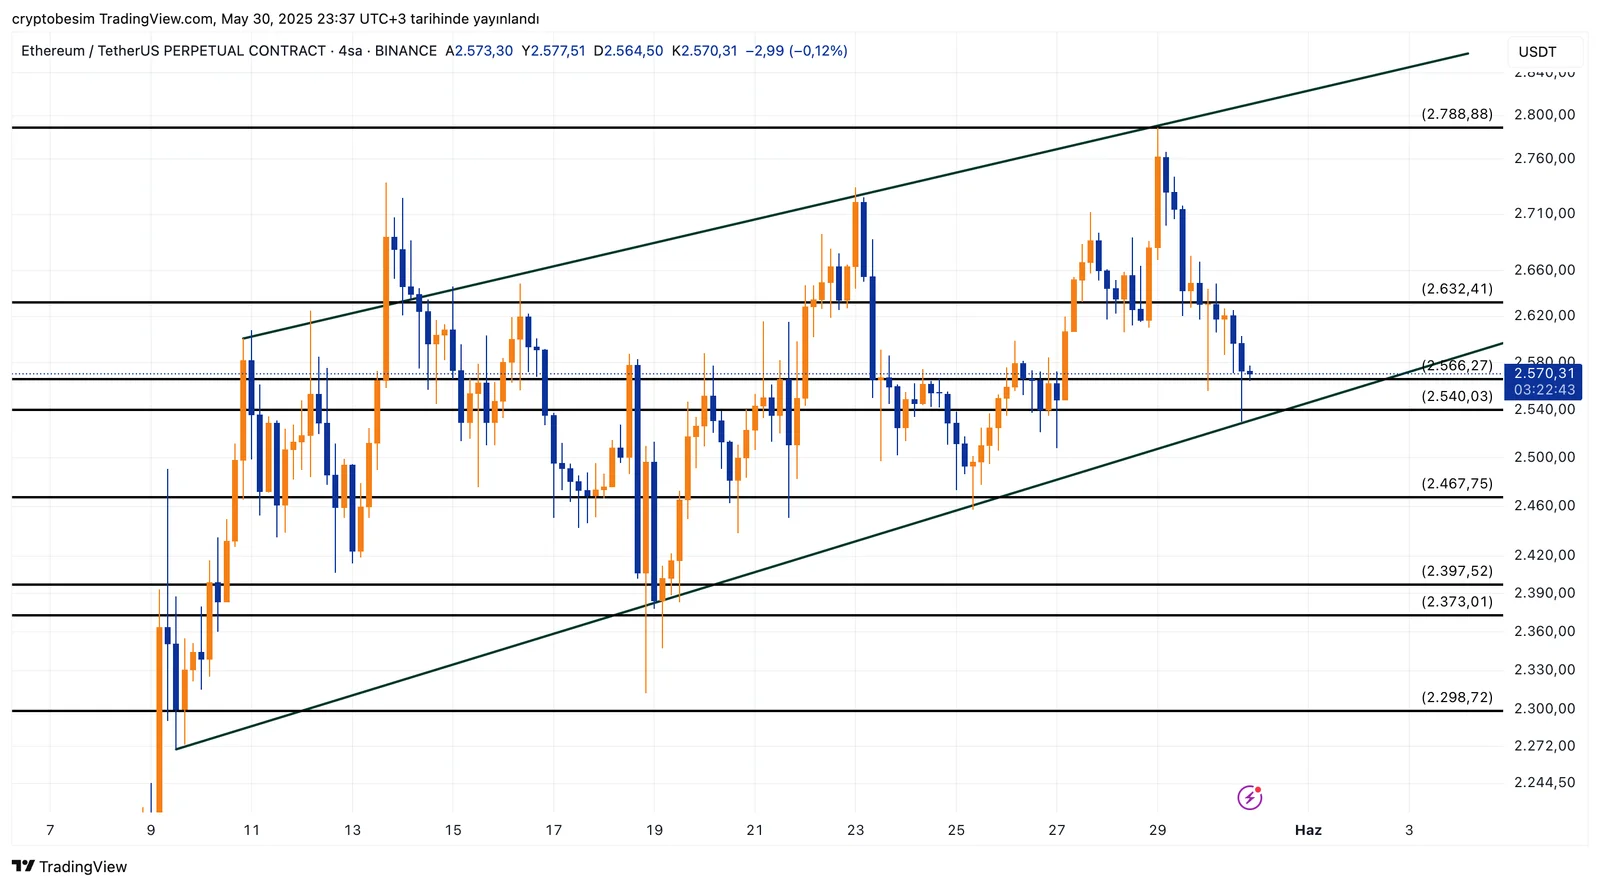
ETH is currently attempting to hold above the support line. If it maintains support above $2,540, an upward move toward $2,632 and $2,788 could be expected. However, if it fails to hold above $2,540, a pullback toward $2,467 and lower support levels may occur. The breakout direction will be key in determining the short-term trend.


