
ETH Technical Analysis
Looking at the chart, we clearly see that Ethereum keeps its ascending channel pattern. The price of the coin failed to stay above the resistance level after going up above the $2,950 and then pulled back to the level of $2,560. There is an ongoing pattern coming from the beginning of May, and the price continues to move towards the trendline test again. It is clearly seen on the chart that the horizontal support at $2,500 and the trend support level intersect, and this level can be said to be a strong buy area. The price needs to hold the level of $2,450–$2,500 in order to keep its ascending structure.
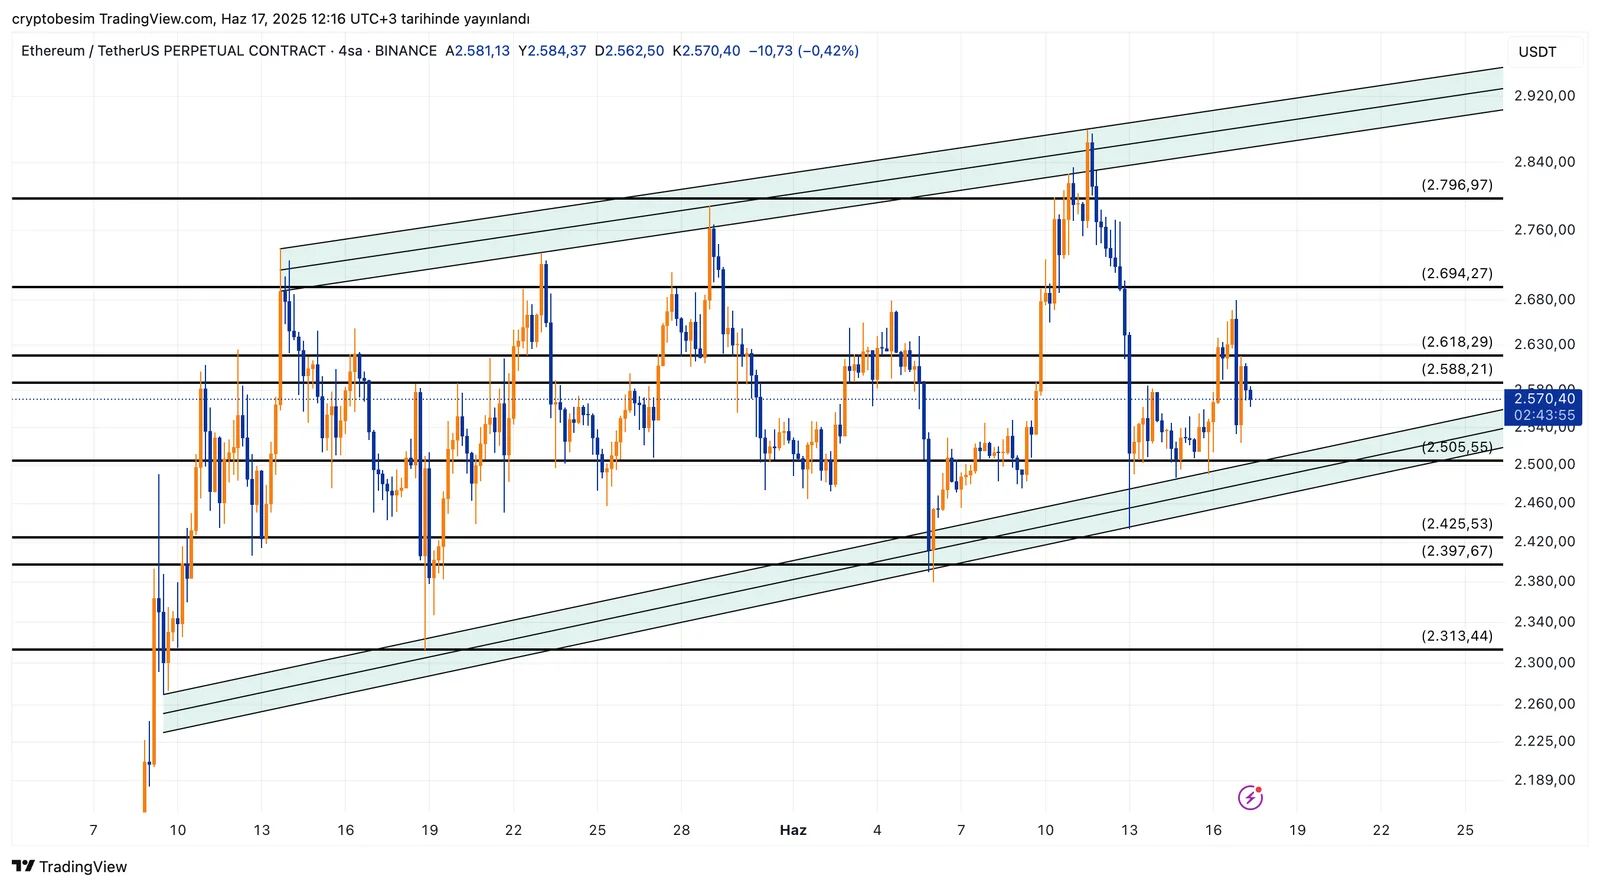
Upward breakouts will be main targets so long as the price stays on the trendline. There is a strong resistance area at $2,590–$2,620, and there should be momentum up to $2,700 with a good green candle if the price must hold above this resistance area. After that, the first resistance level seems to be the level of $2,800, and if this level is exceeded, the price will go up to the trend resistance. It is highly possible that the next test to the trend resistance area will bring a breakout.
These analyses, not offering any kind of investment advice, focus on support and resistance levels considered to offer trading opportunities in the short and medium term according to market conditions. However, the responsibility for making transactions and risk management belongs entirely to the user. In addition, it is strongly recommended to use stop loss (SL) in relation to shared transactions.


