
ENA Short-Term Technical Analysis
The descending triangle pattern has become more defined on the chart. The selling pressure from above is being met lower each time, but the lower support has still not been broken. The horizontal base at the $0.290 region forms the bottom line of the triangle.
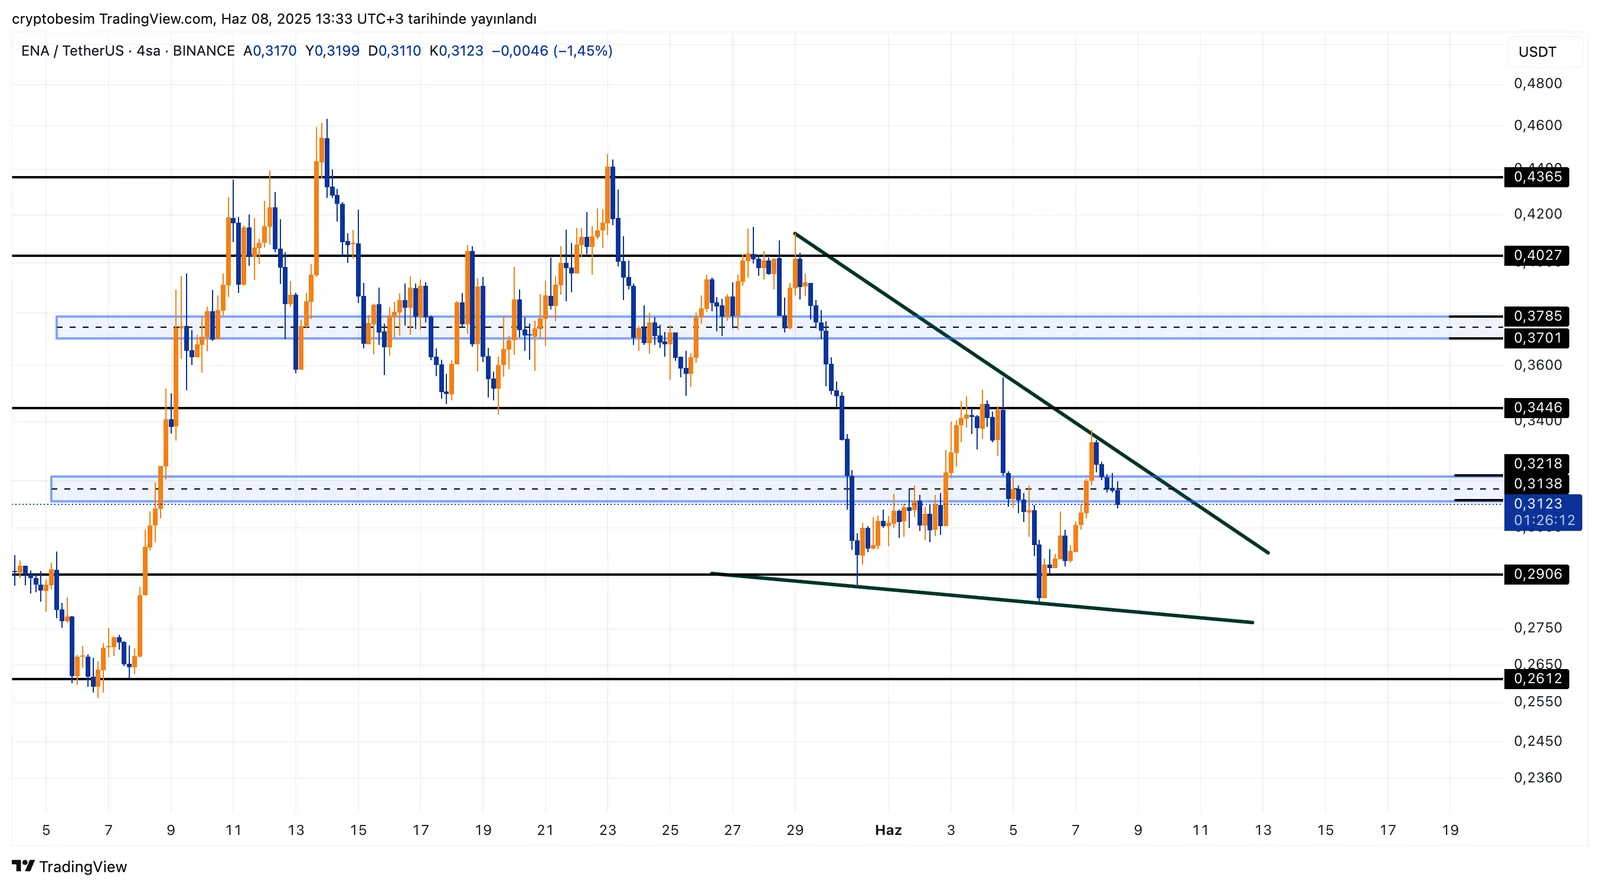
The price is currently at $0.313. A rejection was seen again at the $0.321–$0.324 zone, which is the upper band of the triangle. This pattern typically breaks downward, but confirmation has not yet come.
The $0.290 support has held strong so far. However, being tested multiple times means it has weakened. If this area breaks, the first technical target based on the formation could be $0.261, followed by the $0.236 region.
The upward scenario should not be ignored either. Especially if there are high-volume closes above $0.321, the descending structure would be broken, and the first resistance levels at $0.344 and $0.370 could be tested.
The overall outlook is under pressure. Volume is low. Price is squeezed. The triangle is nearing its end. When the breakout comes, the direction will also become clear. The $0.290 level, in particular, may play a critical role this week.


