
EIGEN Technical Analysis
The EIGEN chart clearly demonstrates a downward breakout following the consolidation in the upper region. There is a descending trend pattern forming in the short term, and we see that there has not been a strong breakout in this trend yet; the price has been rejected from this area again.
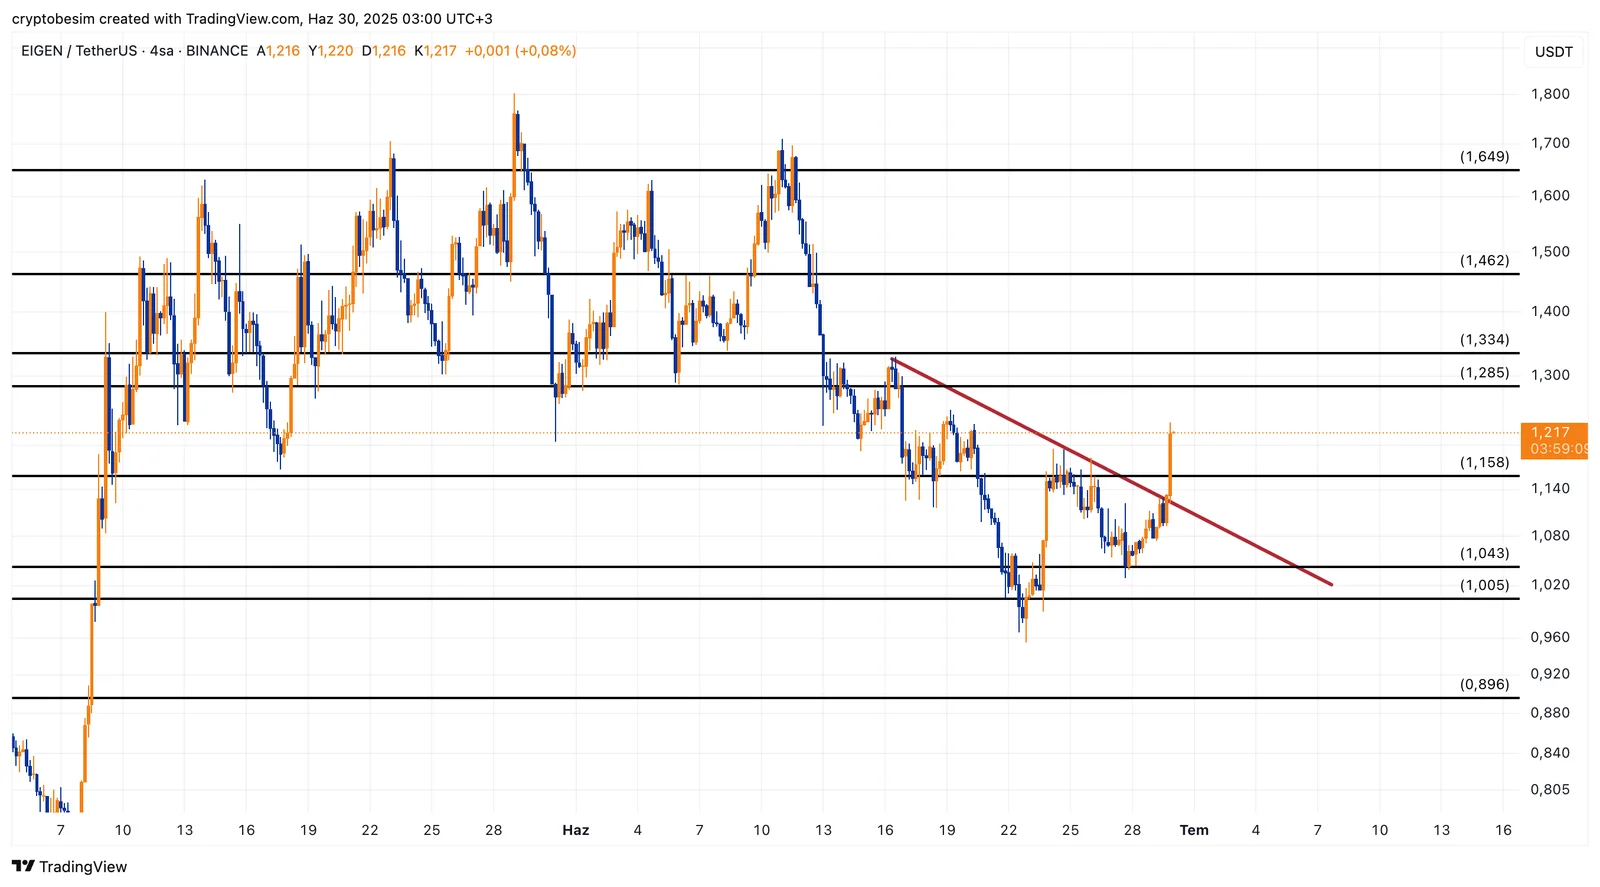
Looking from a wide perspective, the price has rebounded and risen from the strong support area of $1.00 - $1.04 twice so far. In case of price closings below this support zone, the level of $0.89 might be possible then.
On the other hand, if we see a breakout, $1.15 will be the first target, and then the price may want to test the resistance area of $1.28 - $1.33. The next possible test of the trend could bring a breakout.
These analyses, not offering any kind of investment advice, focus on support and resistance levels considered to offer trading opportunities in the short and medium term according to the market conditions. However, the user is responsible for their own actions and risk management. Moreover, it is highly recommended to use stop loss (SL) during the transactions.


