
EIGEN Technical Analysis
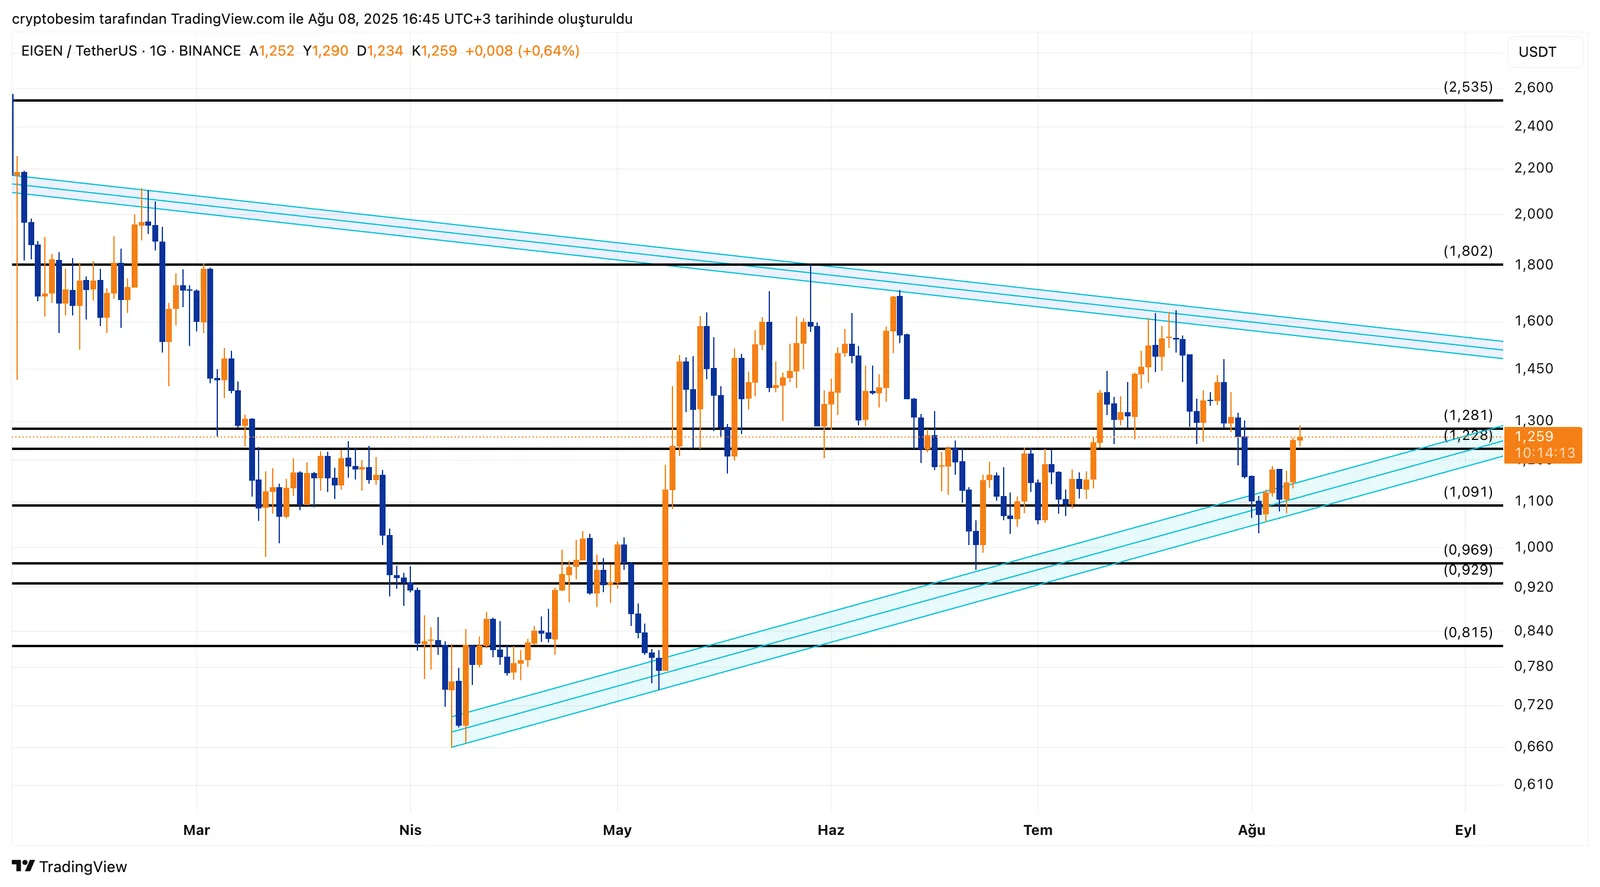
The contracting triangle pattern is clearly evident on the EIGEN chart. The price has moved into the formation’s compression zone, characterized by higher lows and lower highs. This setup signals the potential for a sharp move once a breakout occurs.
The current price is at $1.259, and the $1.22-$1.28 range acts as horizontal support. As long as this zone remains intact, the formation remains positive.
On the upside, the $1.60 region marks the upper boundary of the formation. A breakout above this level would generate a technical target based on the height of the triangle, potentially bringing the $1.80 and $2.53 levels into focus in the medium term.
In a downward breakout scenario, the initial support is $1.09, followed by the $0.969-$0.929 range. A loss of these zones could invalidate the formation.
In summary:
- Price: $1.259
- Support zone: $1.22 – $1.09
- Upper band of the triangle: $1.60
- Targets in case of an upward breakout: $1.80 → $2.53
- Support in case of a downward breakout: $1.09 → $0.969 → $0.929
This analysis does not constitute investment advice. It focuses on support and resistance levels that may present trading opportunities in the short to medium term, depending on market conditions. All trading decisions and risk management remain the sole responsibility of the user. The use of a stop-loss is strongly recommended for all trades mentioned.


