
EDU Technical Outlook
Analyzing the EDU chart on a daily time frame, we see that there is a symmetrical triangle formation. As seen on the chart, price action is stuck between the downtrend line from above and the support line below. We know that such patterns usually end up with strong price movements depending on the direction of the breakout.EDU is currently trading at around $0.1251, but it rebounded from the lower border of the triangle formation at the level $0.1200 just a while ago. The level $0.1286 stands as the first resistance level. In the event of an upward breakout, the level at $0.1338 stands out as the formation's upper border.We should be following the levels at $0.1900 and then $0.2400 if this triangle pattern breaks upward, as these areas overlap with both the areas that have seen sharp reactions in past pricing and the formation's projection targets.We have the support levels at $0.1200 and $0.1136 in case the price breaks downward. Below these levels, it is possible to see a deeper correction.
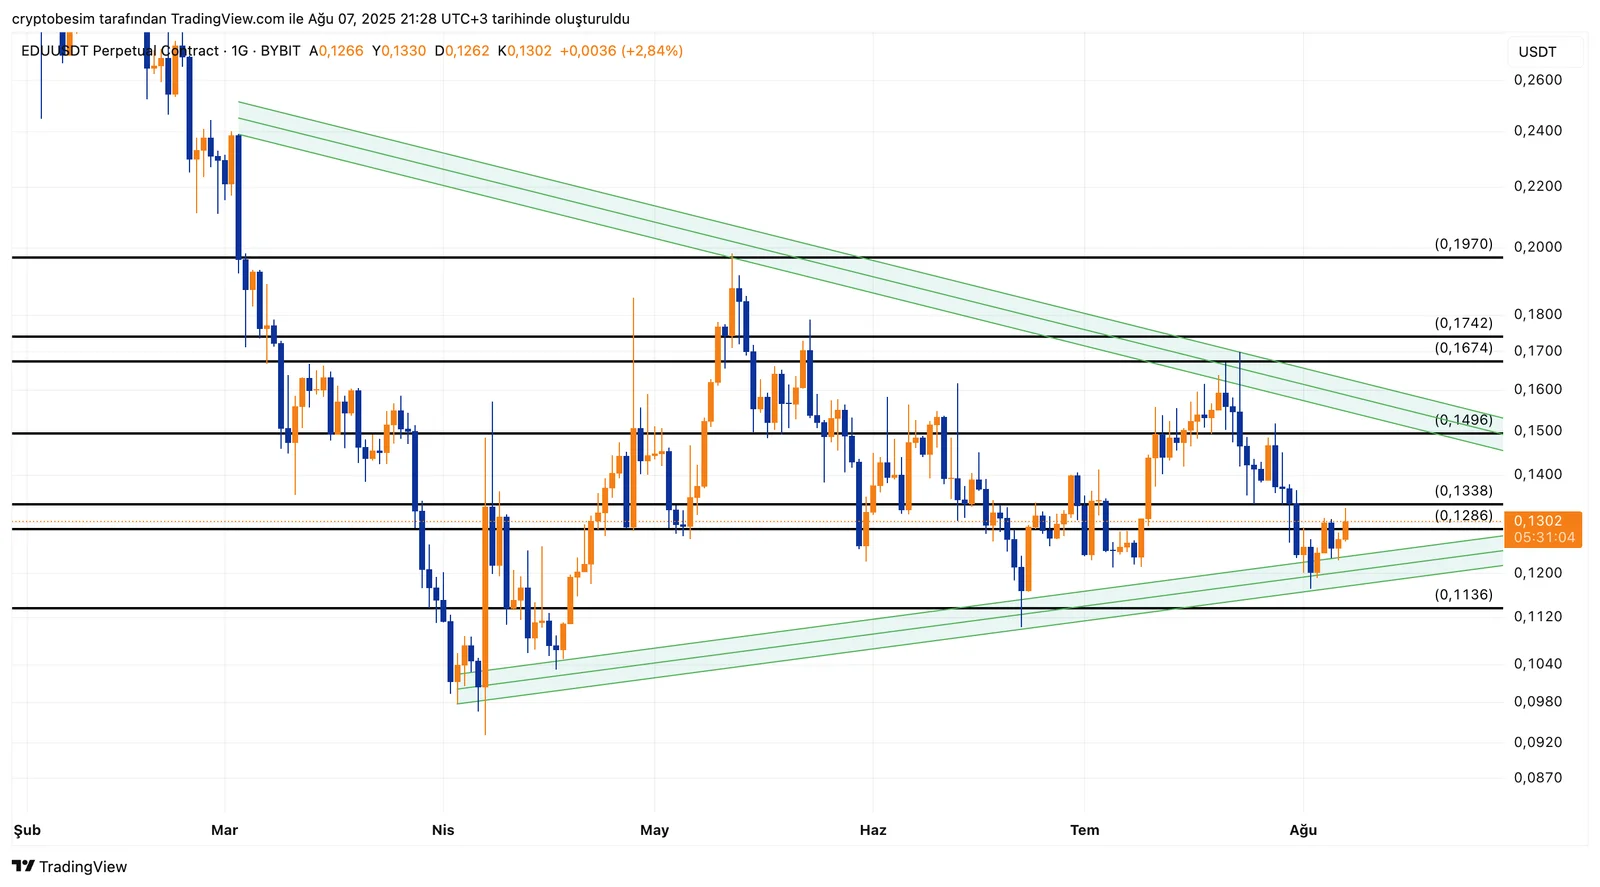
- Summary:• Formation: symmetrical triangle on daily time frame• First resistance levels: $0.1286 → $0.1338• Triangle breakout targets: $0.1900 → $0.2400• Support levels: $0.1200 → $0.1136• The direction of the breakout will be decisive for medium-term direction.
These analyses, not offering any kind of investment advice, focus on support and resistance levels considered to offer trading opportunities in the short and medium term according to the market conditions. However, traders are responsible for their own actions and risk management. Moreover, it is highly recommended to use stop loss (SL) during trades.


