
CRV Technical Analysis
Looking at the CRV chart, we see a descending channel pattern similar to what we observe in most of the market nowadays. The price of the coin has managed to maintain this pattern with regular tests to the lower and upper borders after re-entering the channel, even though the pattern was violated once last month.
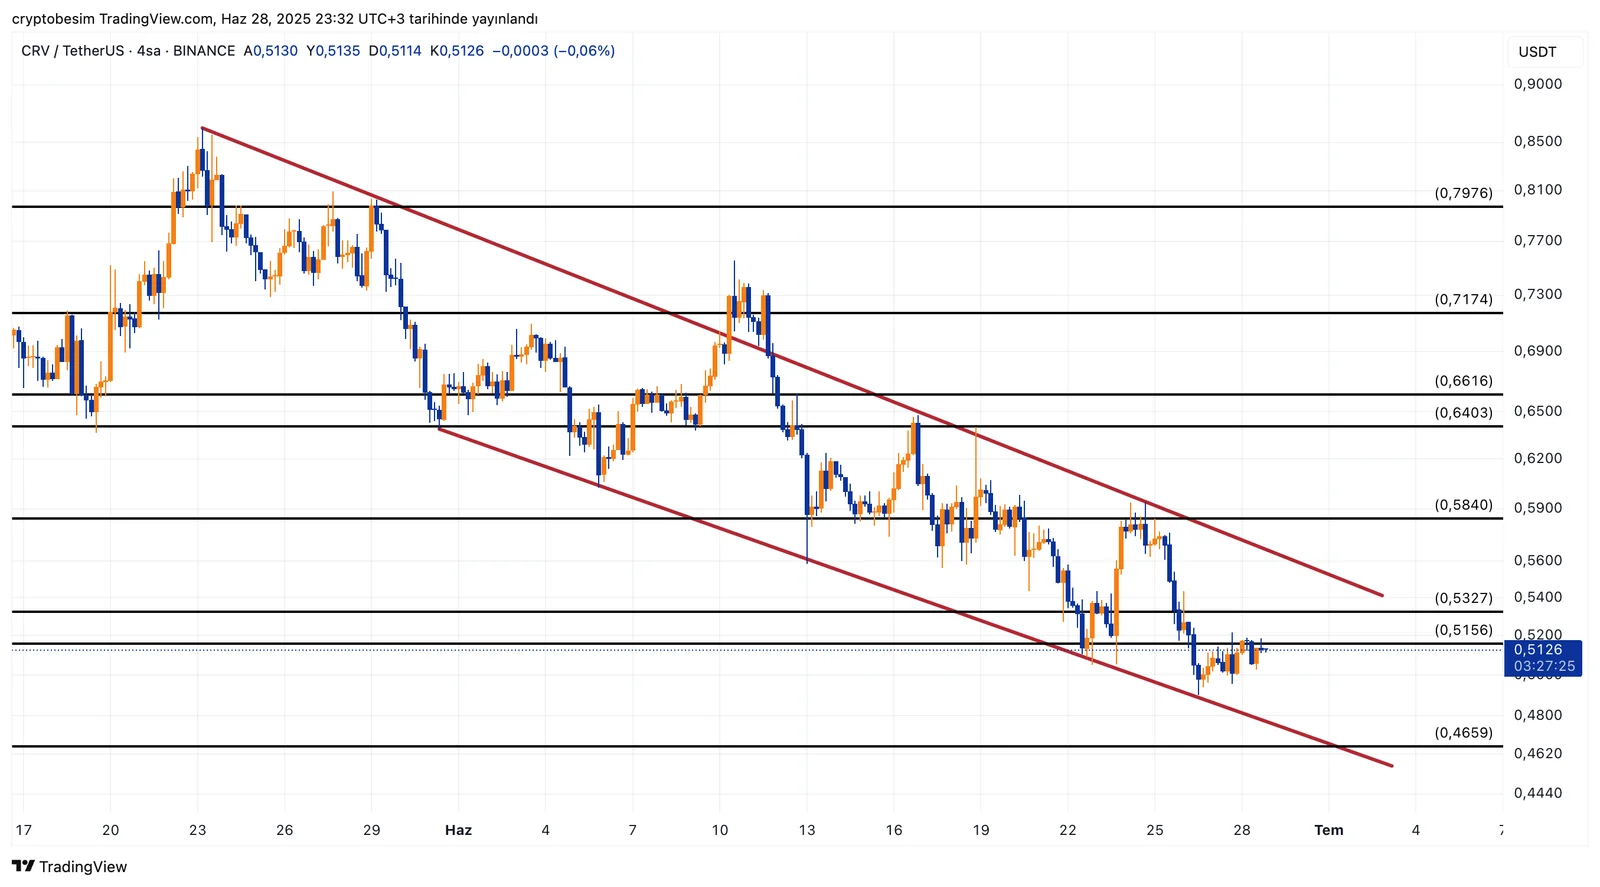
It is obvious on the chart that the price level of $0.51 - $0.53 appears to be an important area, yet the price has fallen below this zone. If CRV tests and can hold above this level, we can expect the price to further test the upper trend zone, which is around $0.56. Otherwise, we may see a test to the lower border of the descending channel if the price cannot hold above the resistance zone it is in now. We have $0.46 as the horizontal support level.
In short, the possibility of a breakout is technically high if the price breaks out above the resistance and tests the upper border of the channel. If such a breakout occurs, the resistance area of $0.64 - $0.66 will be the main target in the short term.
These analyses, not offering any kind of investment advice, focus on support and resistance levels considered to offer trading opportunities in the short and medium term according to the market conditions. However, the user is responsible for their own actions and risk management. Moreover, it is highly recommended to use stop loss (SL) during the transactions.


