
CETUS Technical Outlook
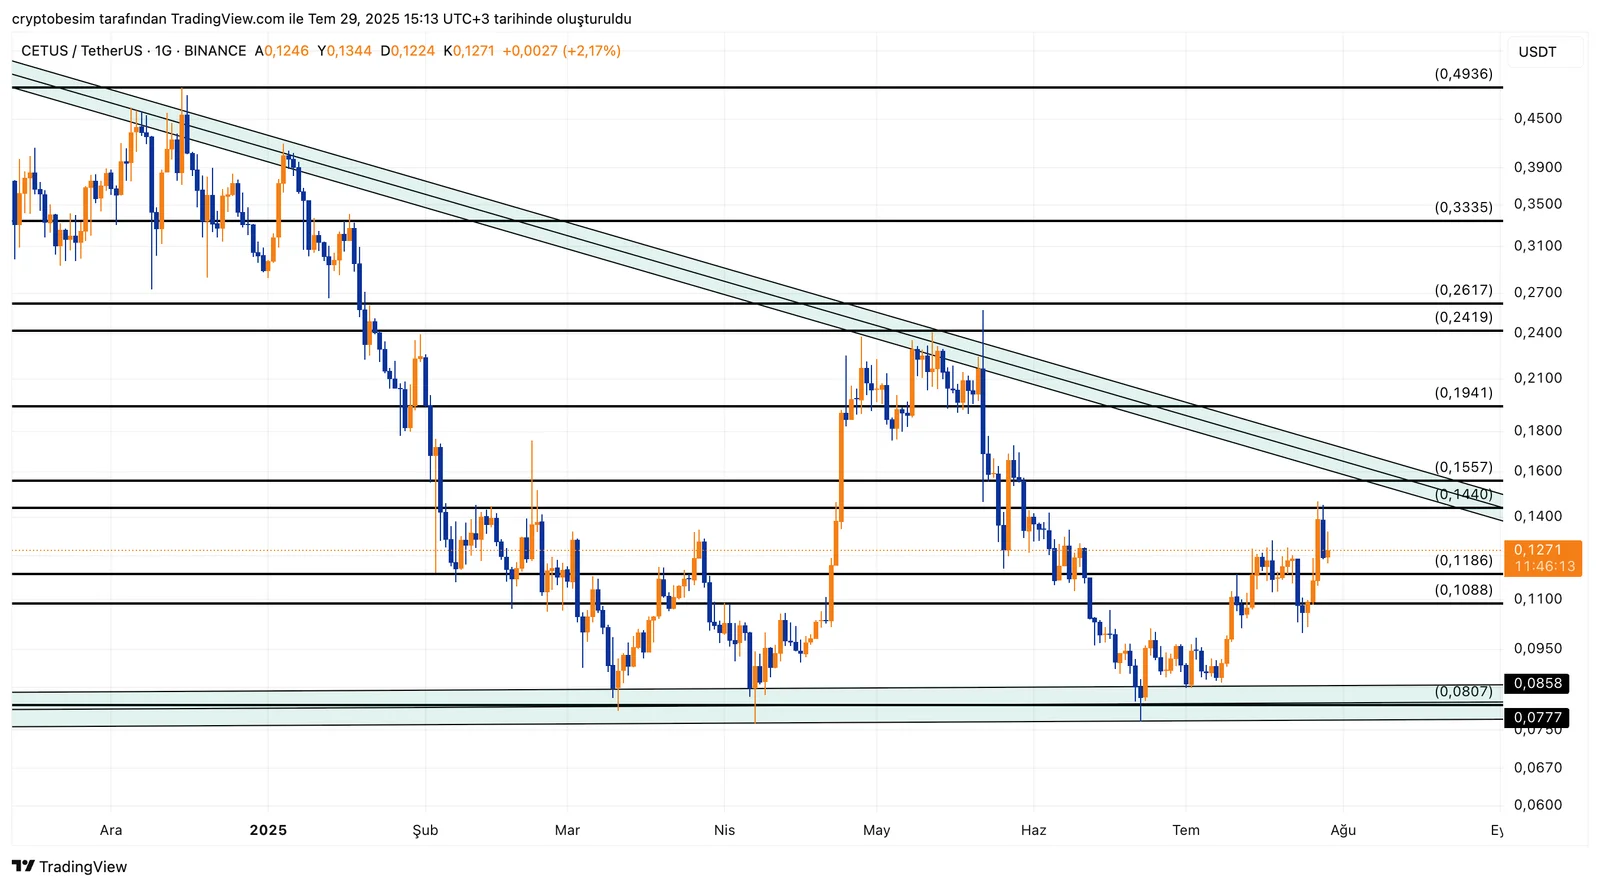
CETUS has been trading within the descending triangle formation for a long time, and we can see that it is gradually approaching the upper zone. Looking at the chart, it is obvious that there is a narrowing area, and CETUS is trading around the level at $0.12.
The first resistance level will be around the level at $0.155 if the price can break out of this narrowing pattern. Breaking through this zone suggests the price could gain momentum. The range between the levels at $0.194–$0.241 seems to be a major resistance zone. Especially the level at around $0.24 could be the first target level after the breakout.
In the event that the downward sell pressure continues, the first support level will be $0.118, followed by $0.108. If the price drops below this level, the lower horizontal support area of the triangle at $0.077 appears to be the major support area.
Summary:
- The price is trading at around $0.1271, within the narrowing area.
- In case of a breakout, the first target is $0.1557, followed by $0.1941 → $0.2419
- Short-term price target is $0.24
- In case of downward pressure, support levels are $0.1186 → $0.1088 → $0.0858 → $0.0777
These analyses, not offering any kind of investment advice, focus on support and resistance levels considered to offer trading opportunities in the short and medium term according to the market conditions. However, traders are responsible for their own actions and risk management. Moreover, it is highly recommended to use stop loss (SL) during trades.


