
Bitcoin Technical Analysis – Critical Touch at the Upper Band of the Descending Channel
On the 4-hour chart, Bitcoin has reached the upper boundary of the descending channel it has been moving within for a while. The price is currently at $106,563. The key technical threshold at $107,171, which is the upper limit of the channel, is now being tested.
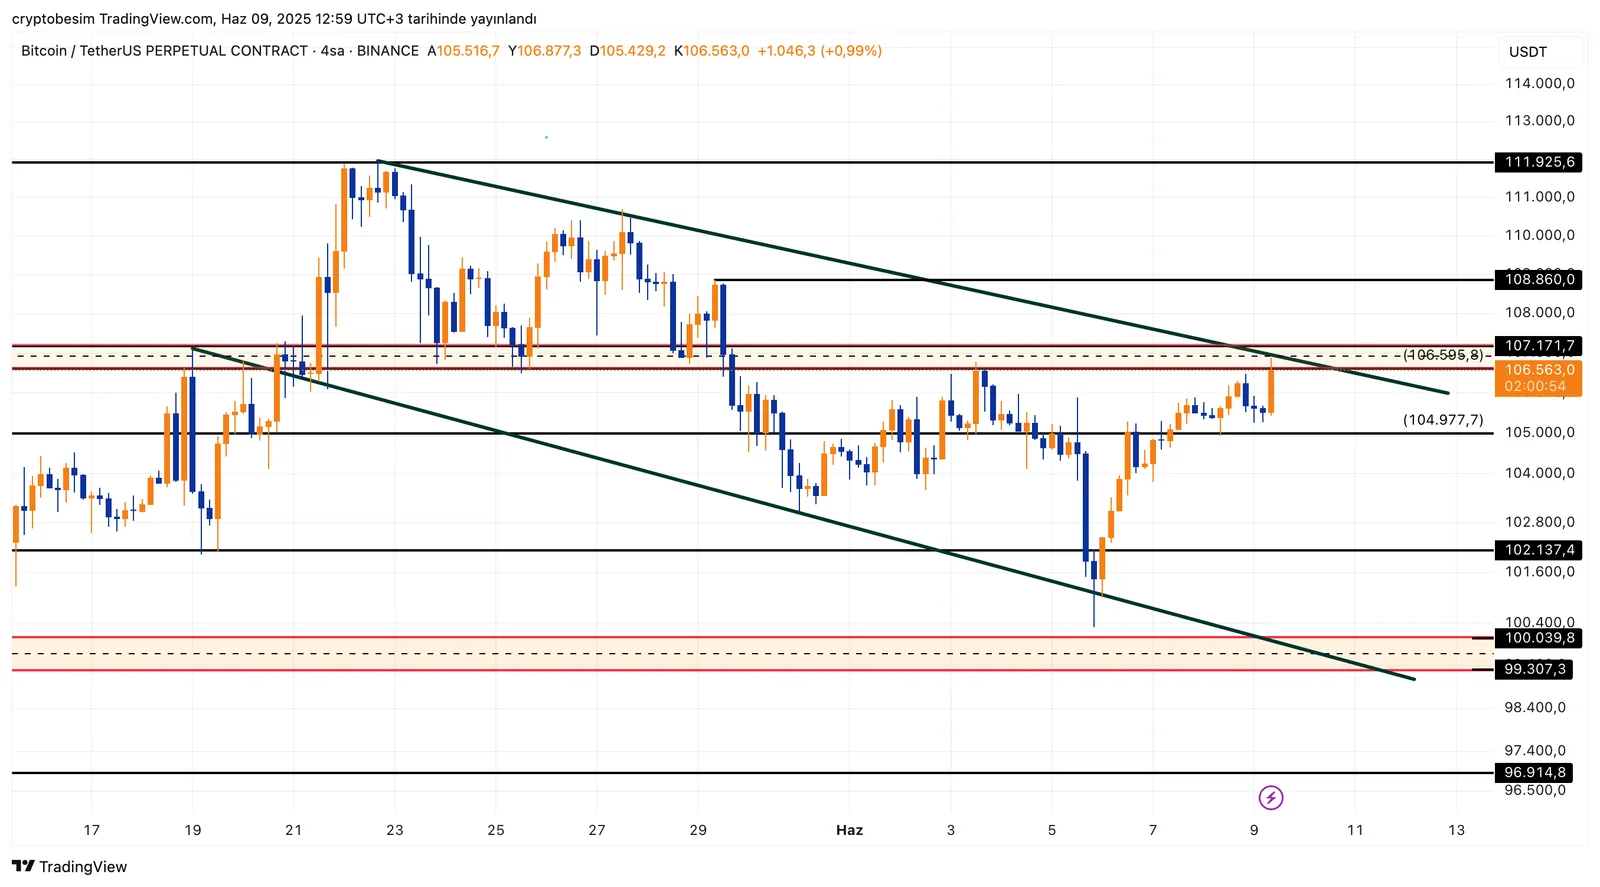
The first notable detail on the chart: The price has reached both the descending trendline and the horizontal resistance zone of $106,595–$107,171. Without a breakout of this area, it’s difficult to talk about a clear upward momentum.
If a breakout occurs, a target equal to the height of the channel would form based on the technical structure. The lower band of the channel lies around $99,300, while the upper band is near $107,000. In case of an upward breakout, the target could be in the $113,000–$114,000 range.
However, volume confirmation is crucial at this point. Without daily closes above this resistance zone, it’s too early to say the breakout is permanent. Especially closes above $107,171 could accelerate momentum.
In the downside scenario, the first level to watch is $104,977. If this support is broken, BTC may slide back down within the descending channel, targeting first $102,137 and then the $99,300 support zone.
In summary:
- BTC is testing the upper band of the descending channel.
- A close above $107,171 could confirm an upward breakout.
- If confirmed, the target could be in the $113,000–$114,000 range.
- On the downside, $104,977 and $102,137 support levels should be watched closely.
- As the decision point approaches, volume and closing prices will be key.


