
BTC (4-Hour Chart) Technical Analysis
Bitcoin (BTC), on the 4-hour chart, broke below the ascending trendline located around the $106,000 region and confirmed this technical breakdown by retesting the trendline twice. During these retests, the price also failed to surpass the horizontal resistance zone between $105,000 and $106,000, indicating that downward momentum is gaining strength in the short term.
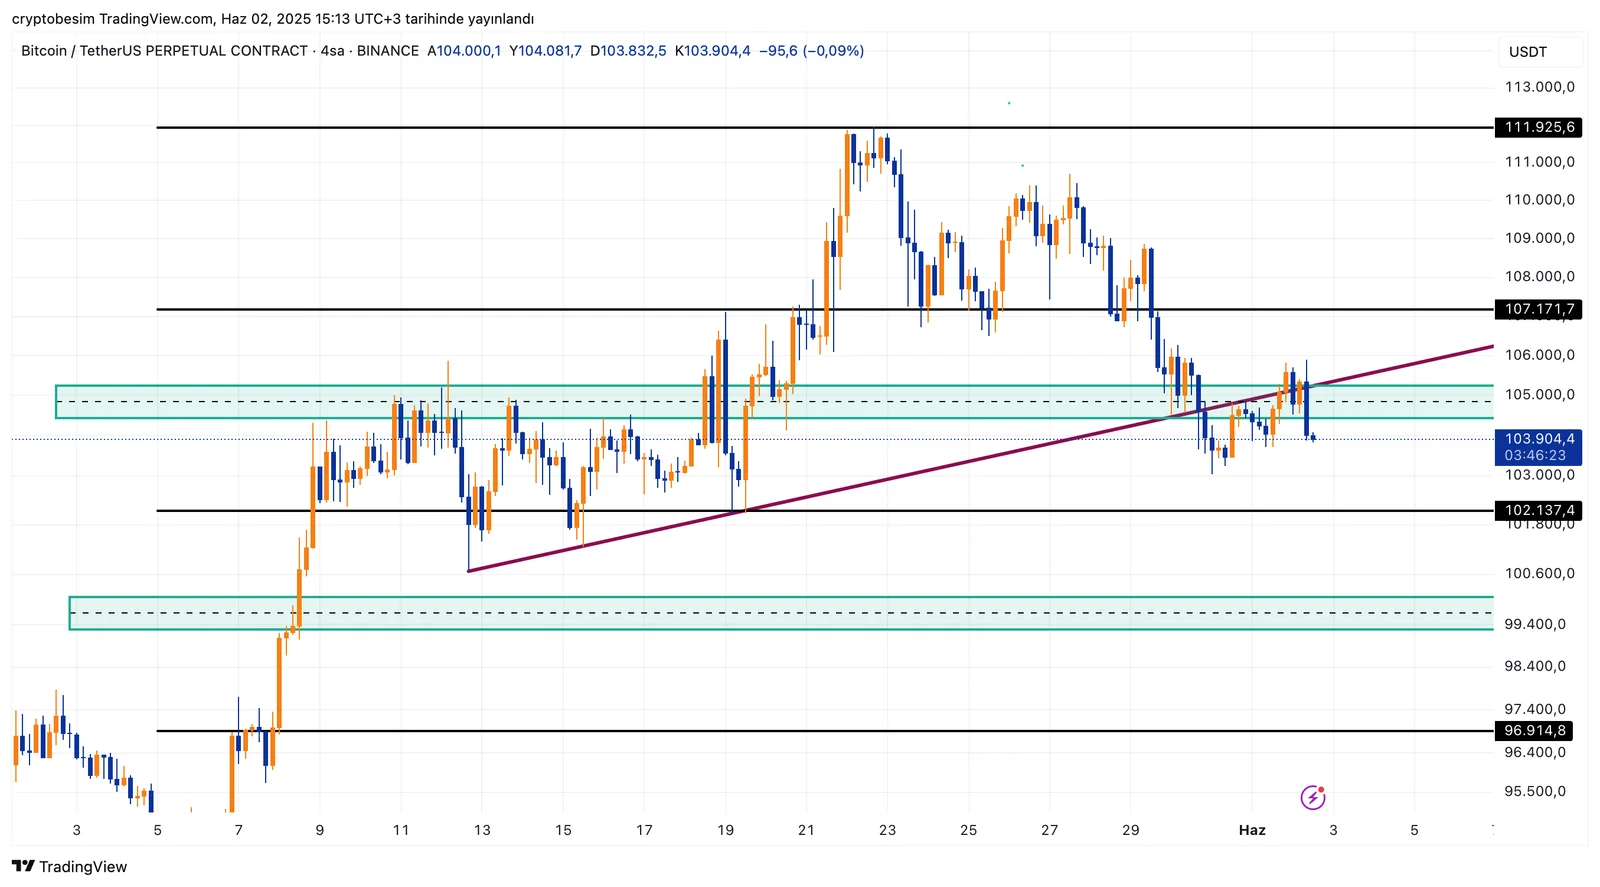
As of now, the price is hovering around the $104,000 level. This area is both a psychological level and a zone where short-term reaction points are located. However, for buyers to regain control, the price must first settle above $105,500. Otherwise, downward pressure may continue.
The nearest strong support zone lies in the $99,000 – $101,000 range, where the price previously consolidated before a sharp upward movement. This zone stands out as a critical short-term defense line due to its nature as a horizontal support and the volume-based demand concentration in this area. A potential pullback to this region may attract increased buying interest.
On the upside, the $106,000 and subsequently $107,170 levels should be monitored as resistance. Especially, sustained movement above $107,170 could invalidate the short-term bearish scenario and potentially drive the price back up toward the $111,925 level.
Looking at the broader picture, Bitcoin’s recent all-time high confirms that the medium to long-term trend remains upward. Therefore, the current downward movement can be interpreted as a correction within the main trend for now. However, it should be noted that price action in the short term may remain volatile and cautious.
- In summary:– Trendline break confirmed, short-term pressure increased.– $105,500 – $106,000 is a strong resistance zone.– $99,000 – $101,000 is a critical support zone.– Overall structure remains positive; short-term correction continues.– Long-term bullish momentum may resume with a close above $107,170.


