
BNB Daily Chart Technical Analysis
When analyzing the BNB daily chart from a technical perspective, it’s clear that the price has been moving within a well-defined ascending parallel channel since the beginning of 2024. Supported by the lower boundary of the channel, the ongoing upward trend reflects a sustained medium- to long-term bullish outlook.
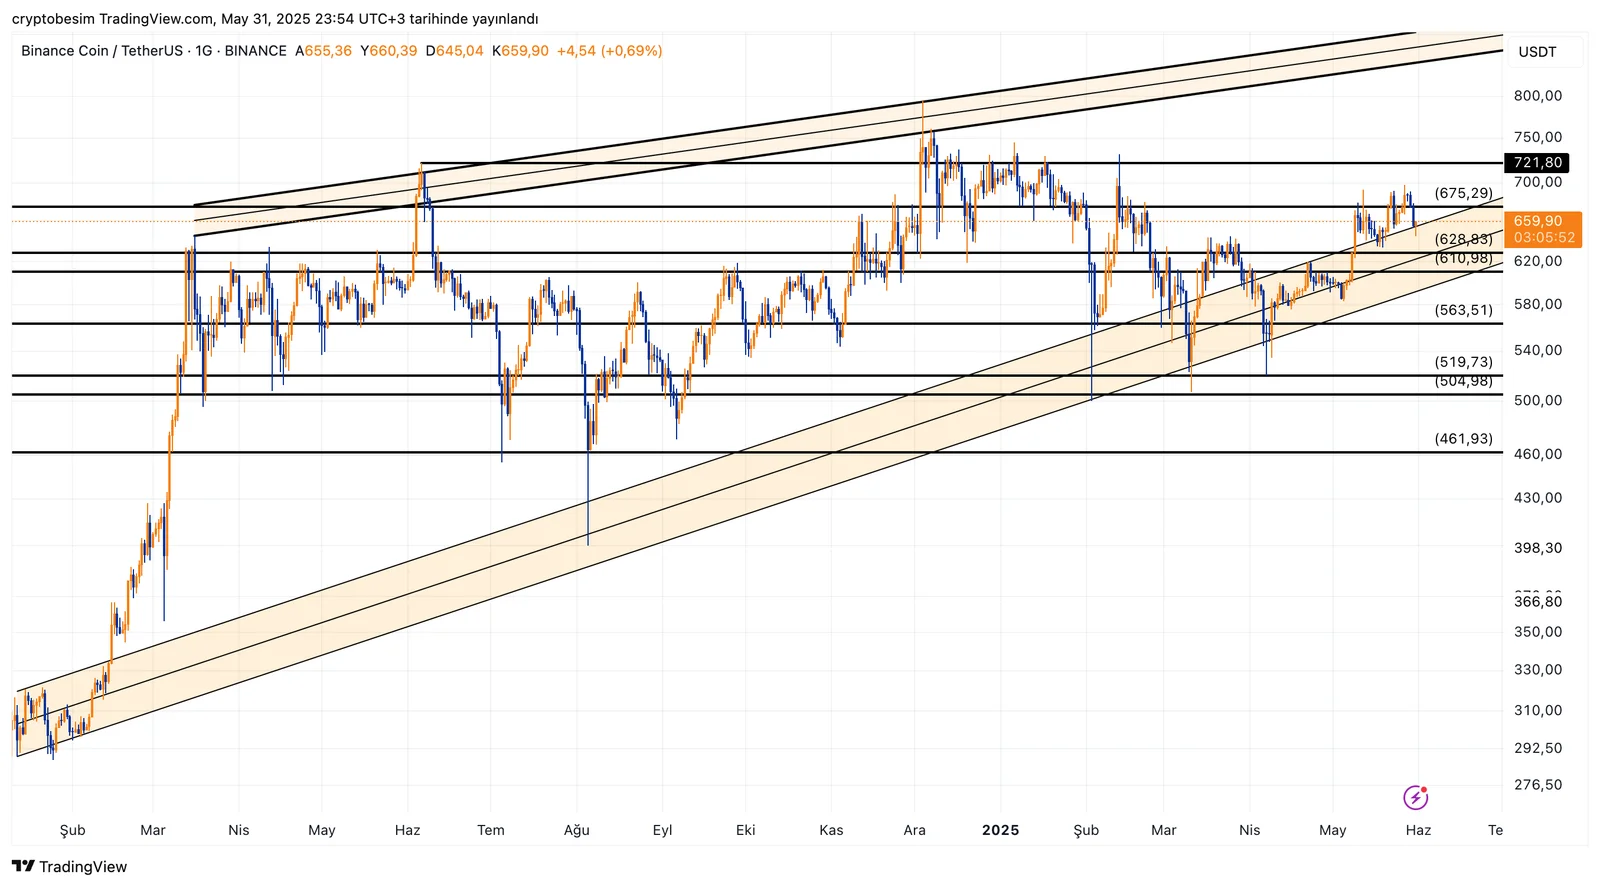
The current price is trading at 659.90 USDT. This level is very close to a key horizontal resistance zone at 675.29 USDT. The 675.29 level has been tested and rejected multiple times in the past, making it a highly significant technical threshold. A breakout above this resistance would be a strong bullish signal, with the next major resistance target at 721.80 USDT. This level is critically important as it represents both a horizontal resistance and the upper boundary of the ascending channel.
On the downside, the first strong support is at 628.83 USDT. If this level fails, the next supports are at 610.98 and 563.51 USDT. Notably, 563.51 USDT is located very close to the lower boundary of the channel, and potential buying interest from this area could be crucial for sustaining the current trend. Below that, 504.98 and 461.93 USDT are the next support levels to watch.
From a chart pattern perspective, there are no notable formations such as a symmetrical triangle, falling wedge, or broadening wedge. Price action is progressing in a clean, classic ascending channel, which allows for the application of simple and clear trading strategies.
While no strong volume breakout has been observed yet, a breakout with increased volume as the price nears the upper channel boundary could accelerate the trend. In particular, daily closes above 675 USDT would serve as confirmation for continued upward movement.
In summary:
- BNB is moving within an ascending channel.
- The 675 USDT resistance is critical for a breakout.
- 721 USDT is the upper target.
- Channel support lies near 563 USDT.


