
BCH Technical Analysis
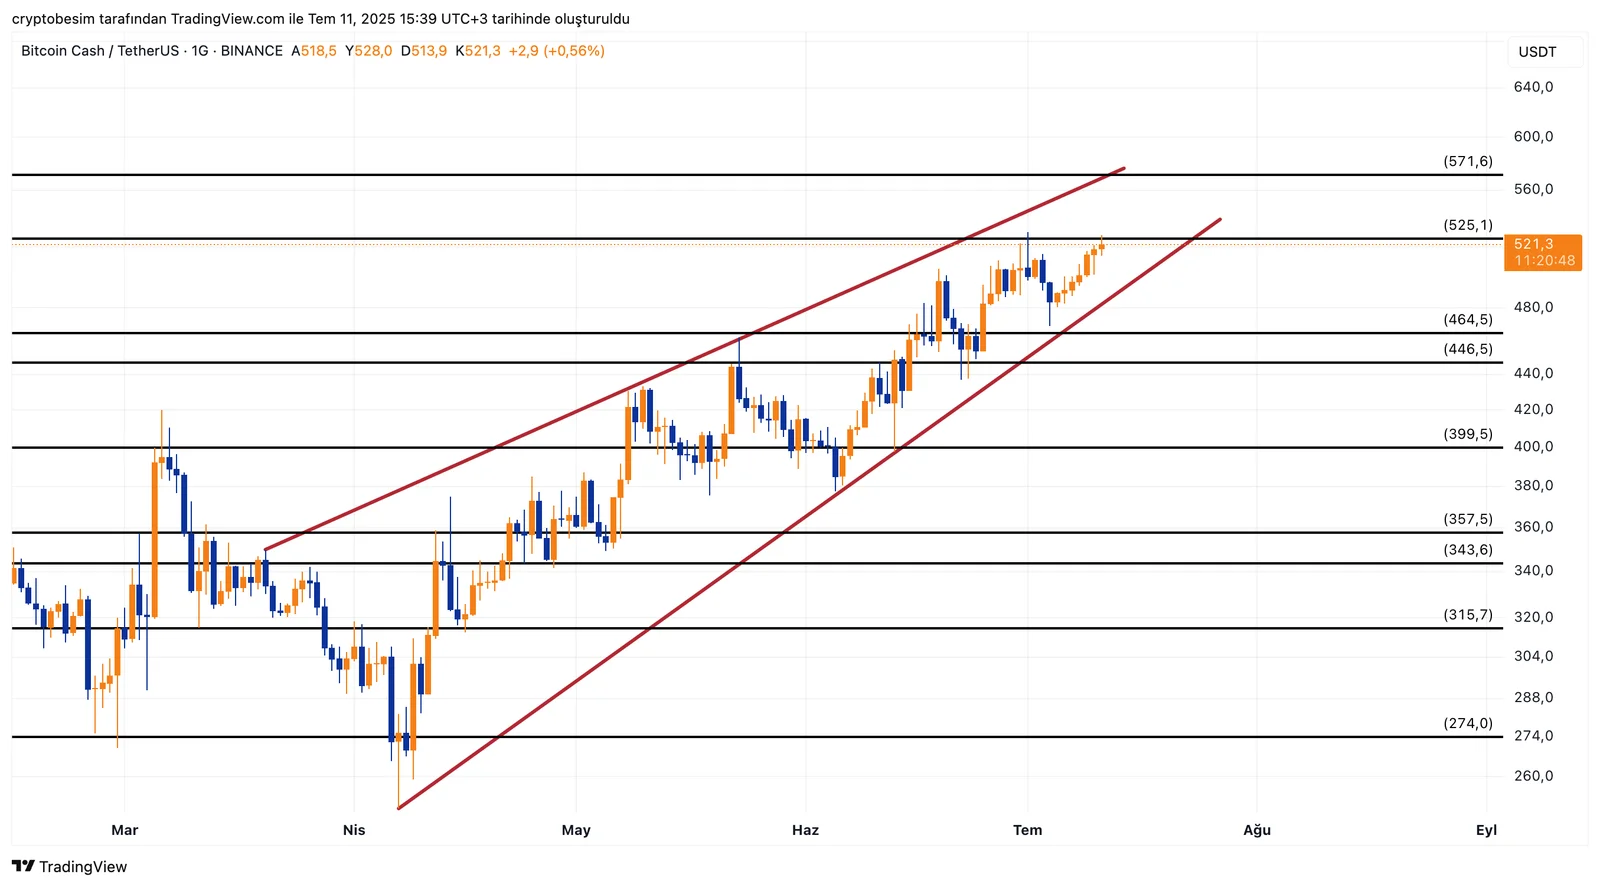
Looking at the BCH/USDT pair, it is clear that there is an ascending channel pattern and an ascending wedge formation mixed together.
This medium-term formation seems to be a continuation of the HH and HL movement. It is worth noting that the formation is trading close to the upper border of the channel. The current price zone of $520–$525 – both an uptrend and a horizontal level – is an important resistance intersection. A possible breakout of this area with strong volume could propel the price to $571, which is a decision point. A breakout or a pullback? It should be monitored closely.
In summary:
- BCH is trading within an ascending channel.
- $520–$525 zone is a strong resistance.
- $464 and $446 can work as support in case of possible pullbacks.
- So long as the channel formation is intact, the technical outlook is positive.
These analyses, not offering any kind of investment advice, focus on support and resistance levels considered to offer trading opportunities in the short and medium term according to the market conditions. However, the user is responsible for their own actions and risk management. Moreover, it is highly recommended to use stop loss (SL) during the transactions.


