
Bitcoin Cash (BCH) Technical Analysis
Looking at the Bitcoin Cash (BCH) chart, it is obvious that the price of the coin has been forming an ascending trend for nearly two years since September 2023 and tested the level of $474.9. This rising price action since April, when it tested the lower band of the channel, took the price close to the critical resistance level of $509, which is where the buyers outperformed sellers many times before.
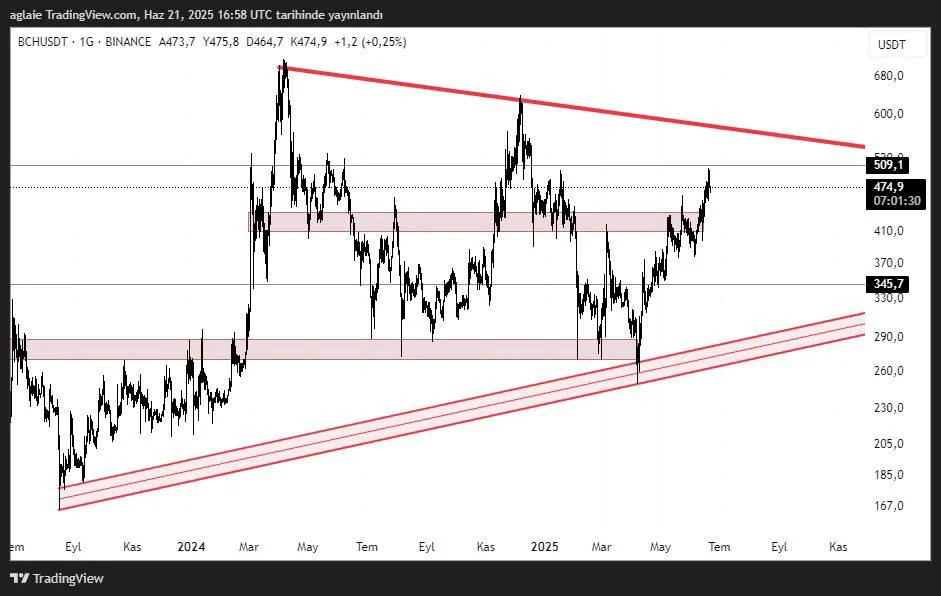
There is a symmetrical triangle formation on the chart of BCH; the price has been trading within this formation and it has approached the upper band of it. The price may target the levels of $580 and $600 if the level $509 gets broken with an upward action and the price closes above it. We can talk about positive upward movement in the future if the descending trend in the upper band of the triangle gets broken. This action could trigger a potential rise in the price towards new areas and maybe to a new ATH.
On the other hand, it is possible that the price will first go down to the strong support channel area around $410 and then to the stronger support level of $290–$300 if the price gets rejected at $509. Price could see an upward movement from this strong level if the buyers outperform sellers.
In summary, BCH is drawing near to the decision moment around the resistance level of $509, which, if broken, can pave the way for a strong rise; however, we have the support level of $345 in case of a possible pullback. The ascending trend structure will continue as long as this level is not broken downwards.
These analyses, not offering any kind of investment advice, focus on support and resistance levels considered to offer trading opportunities in the short and medium term according to the market conditions. However, the user is responsible for their own actions and risk management. Moreover, it is highly recommended to use stop loss (SL) during the transactions.


