
AVAX Technical Analysis - Daily Chart
AVAX is stuck between horizontal support–resistance levels after exiting the Decelerating trend structure that has been going on for weeks. It is currently trading at $20.87 and is trying to hold on just above the $20.10 support. This region is a threshold where buyers have been active recently.
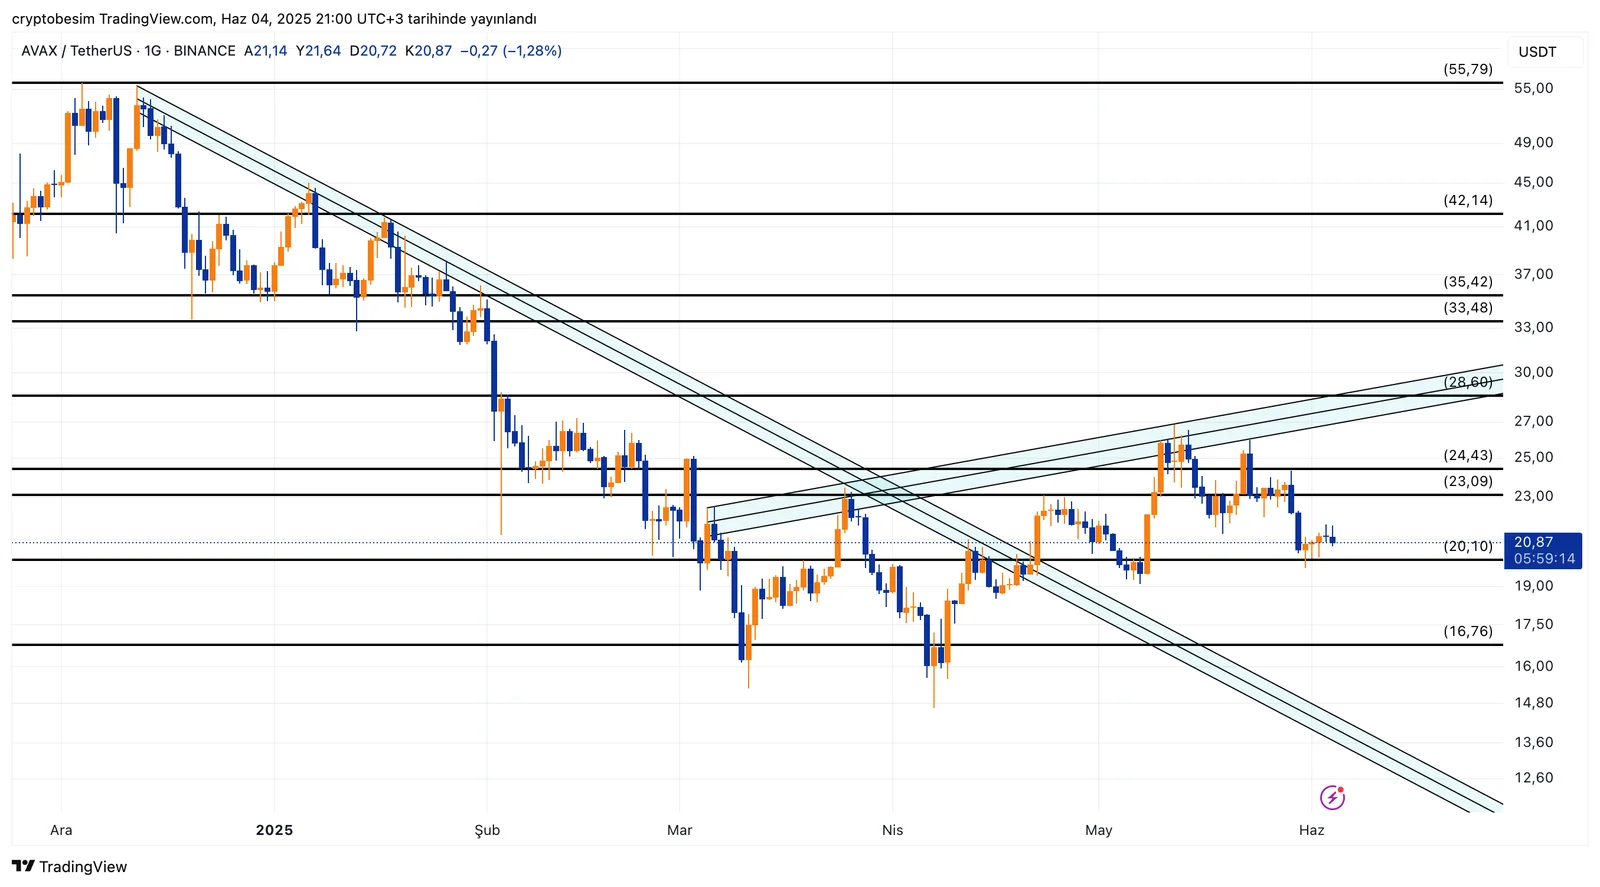
The first line of defense below is $20.10. If this place breaks, there may be a gap up to the $16.76 level. $ 16.76 stands out as a critical threshold due to the fact that it is a long-term support and a previous bottom zone. Persistence below this level can accelerate the decline.
In the upward movements, the first resistance is $23.09. Then, the $24.43 and $28.60 levels should be carefully monitored. It seems difficult for AVAX to start a strong trend again, especially unless there are closures above $28.60. This level was the region where the falling trend was broken, but permanence could not be achieved.
In general, AVAX is moving horizontally in the short term. As long as it remains above $ 20.10, the possibility of a recovery remains on the table. However, as long as a strong momentum is not captured, upward movements may remain limited in the resistance zones.


