
AVAX Technical Analysis
Looking at the AVAX chart, it can be seen that a formation has occurred from early 2024. This downward formation is narrowing, and the price is trading in the middle band of this channel.
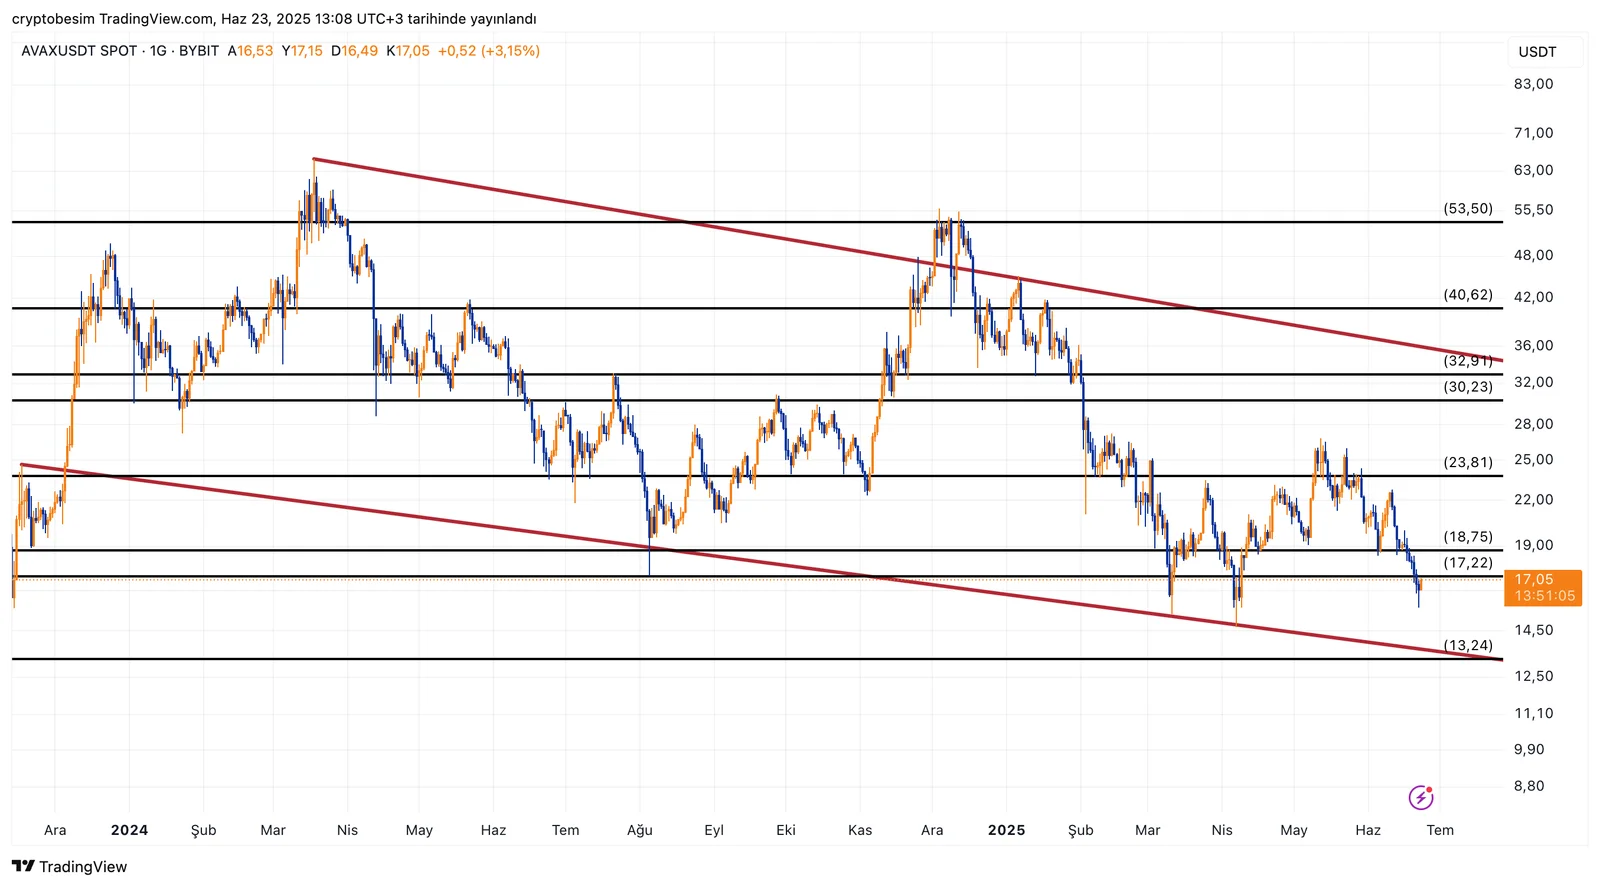
The price is likely to see a resistance around this level. The downtrend has been continuing with this fall; however, in case the price turns upwards, the first level to exceed will be $20, and then $24 seems to be important resistance levels.
These analyses, not offering any kind of investment advice, focus on support and resistance levels considered to offer trading opportunities in the short and medium term according to the market conditions. However, the user is responsible for their own actions and risk management. Moreover, it is highly recommended to use stop loss (SL) during the transactions.


