
AVAX Technical Analysis
Just like Solana, on the AVAX/USDT chart, it can be clearly observed that the price has formed a pattern since the beginning of 2024. The price of the coin continues downwards within the narrowing channel pattern, and the price itself stands in the middle band of the channel.
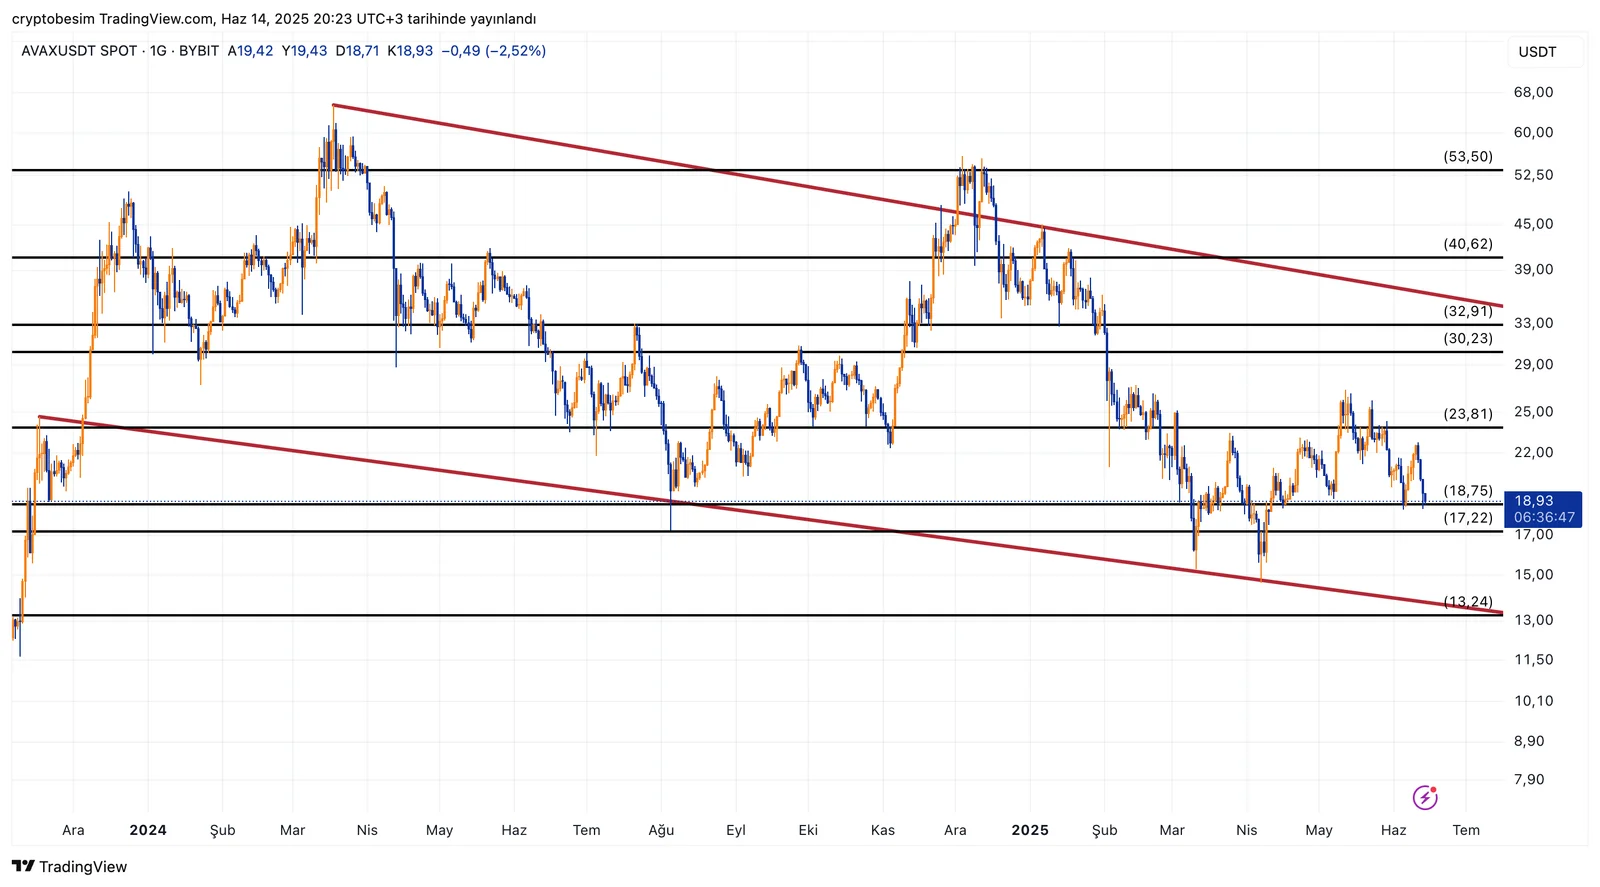
The price is in a critical area in terms of the horizontal support, where the daily support range is $17.22–$18.75. This level has been tested many times before and has found support from here. Remember that each individual test to the support area weakens it, though. As a result, if this level is lost, then the trend may take the price to the trend support, which is $13–$15.
However, if the price rises upwards, we have an initial resistance level of $23.8, and exceeding this area will have the target around $33, which is both horizontal and trend resistance.
These analyses, not offering any kind of investment advice, focus on support and resistance levels considered to offer trading opportunities in the short and medium term according to market conditions. However, the responsibility for making transactions and risk management belongs entirely to the user. In addition, it is strongly recommended to use stop-loss (SL) in relation to shared transactions.


