
Aptos (APT) Technical Analysis
As clearly seen on the chart, the price of the coin has been trading in a descending channel for a very long time. This pattern, causing the price to react from the upper band of the channel with each upward movement, has started forming in January 2025 and still continues. Aptos is currently trading in a very critical area, close to the lower band of the channel, and intersects with the horizontal support.
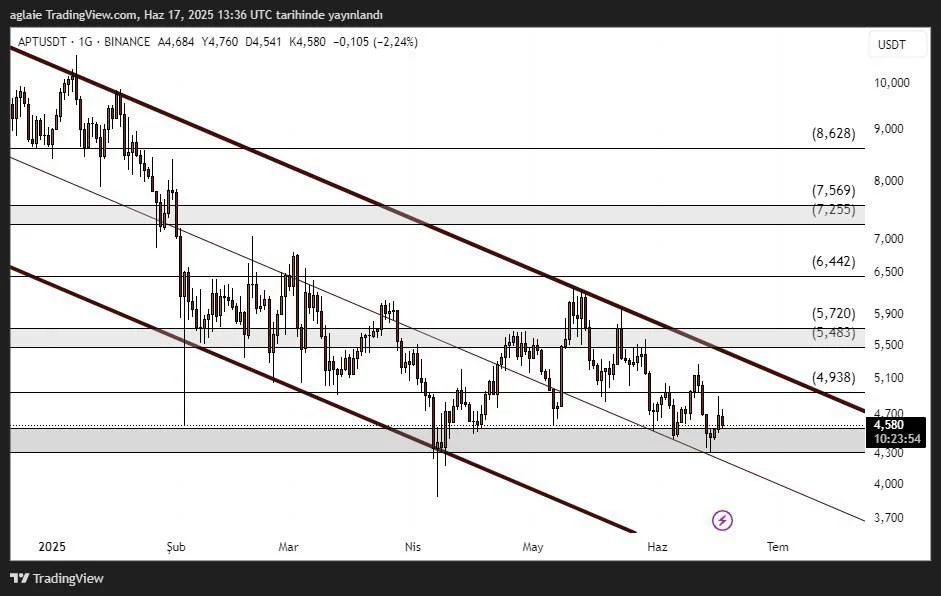
The zone $4.30–$4.00 is where buyers are quite strong, and we see that the price has reacted from this support area many times before. Aptos price could go up to the $4.70–$4.90 range again with buying pressure coming from this support zone. However, the price range $5.48–$5.72 can be expected to act as an intermediate resistance in possible upward movements.
The price needs to go above $6.40 for an upward breakout, as this price level appears to be the upper band of the descending channel. If this level is broken upwards, then we might see a quick rise up to the level of $7.25–$8.62; otherwise, the price could go up and down within a limited area in the descending channel. Aptos could offer a short-term buy opportunity if a bottom structure may form in the support area, even though the overall pattern does not look positive. Still, $3.70 could be on the table if the lower band of the channel gets broken downwards.
These analyses, not offering any kind of investment advice, focus on support and resistance levels considered to offer trading opportunities in the short and medium term according to market conditions. However, the responsibility for making transactions and risk management belongs entirely to the user. In addition, it is strongly recommended to use stop loss (SL) in relation to shared transactions.


