
APT Technical Analysis
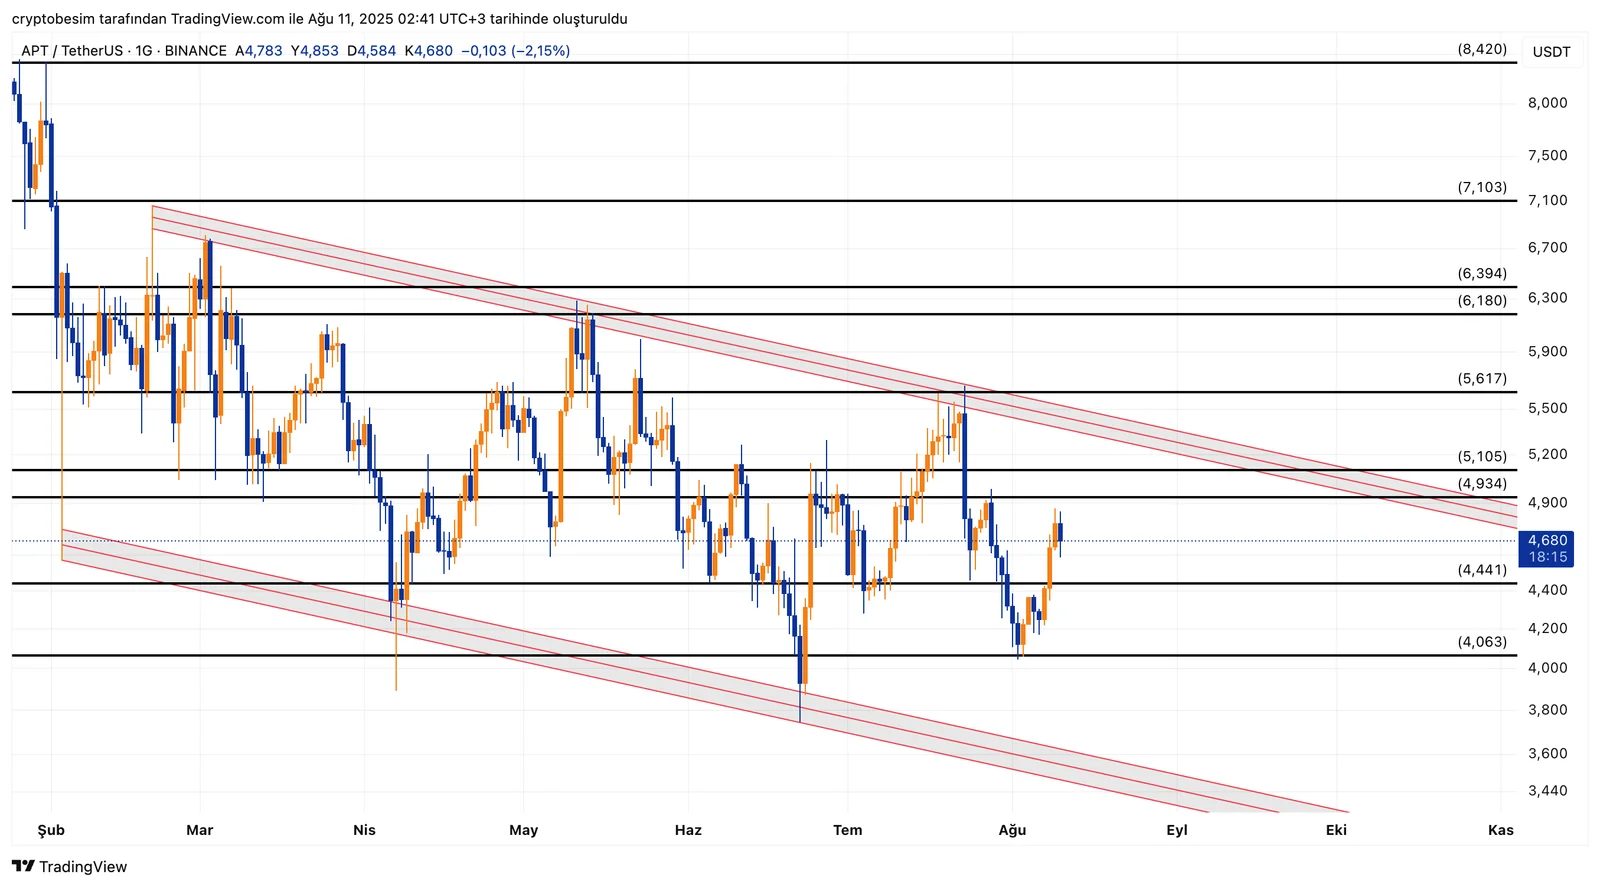
The falling channel pattern remains intact on the APT chart. Following a sharp recent sell-off, the price dropped below the channel’s midline before finding support at the horizontal level of $4.06. This rebound sparked renewed movement within the channel, with the price now trading at $4.60.
The first key threshold for sustaining upward momentum is the $4.93 resistance level. A breakout above this zone could pave the way for a move toward the channel’s upper boundary, located around $5.10–$5.60. However, strong volume will be essential for overcoming these resistance levels.
Otherwise, the price could retreat back to the $4.44 - $4.06 support range. These two zones serve as short-term defensive lines for APT.
If the channel breaks to the upside, the technical target could be projected based on the channel’s length. This points to a potential medium-term move toward $6.18–$6.39, followed by $7.10. The primary target level at $8.40 remains in play.
In summary:
- Price: $4.60
- Short-term resistance: $4.93 → $5.10 → $5.60
- Channel upper band: $5.60
- Short-term support: $4.44 → $4.06
- Upward breakout targets: $6.18 → $6.39 → $7.10
- Channel breakout target: $8.40
This analysis does not constitute investment advice. It focuses on support and resistance levels that may present trading opportunities in the short to medium term, depending on market conditions. All trading decisions and risk management remain the sole responsibility of the user. The use of a stop-loss is strongly recommended for all trades mentioned.


