
Cardano (ADA) Technical Analysis
A striking pattern has emerged on the ADA chart. The falling wedge formations, which have appeared multiple times over the past two years, have consistently led to major upward moves. In the current chart, this pattern seems to have formed for the third time, and an upward breakout has already occurred. In the previous two instances, ADA surged from $0.24 to $0.65 and from $0.27 to $1.30 after breaking out of similar falling wedges. Now, with this third breakout, ADA might be preparing for another strong rally.
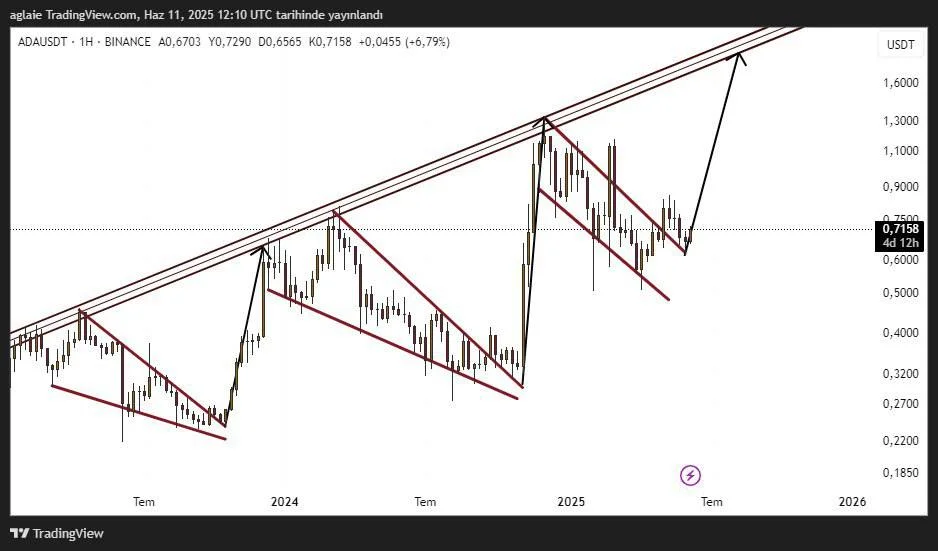
The chart also reveals a long-term ascending trend channel. At present, ADA is positioned near the midline of this channel. If the upward momentum continues, the price could rise toward the upper boundary of the channel—around the $1.60 level. This indicates a potential gain of approximately 120% from the current price of $0.71.
In the short term, the $0.80 and $0.85 levels are likely to act as resistance zones. A breakout above these levels could open the way for further gains. On the downside, the $0.65–$0.60 zone should be watched as key support. Maintaining this support is critical to prevent invalidation of the formation.
In conclusion, if the chart plays out once again as it has in the past, a new bullish wave for ADA may be imminent. Considering the formation structure, trend dynamics, and past price behavior, this setup presents a compelling opportunity for investors.
Disclaimer: This analysis does not constitute investment advice. It focuses on support and resistance levels that may present potential short- to mid-term trading opportunities depending on market conditions. However, all responsibility for trading decisions and risk management lies entirely with the user. The use of stop-loss orders is strongly recommended for any trade setup shared.


