
AAVE Technical Analysis
Looking at the daily chart of AAVE, we can see a downtrend since the end of 2024 along with an uptrend since April 2024 at the same time. AAVE is approaching a breakout each day.
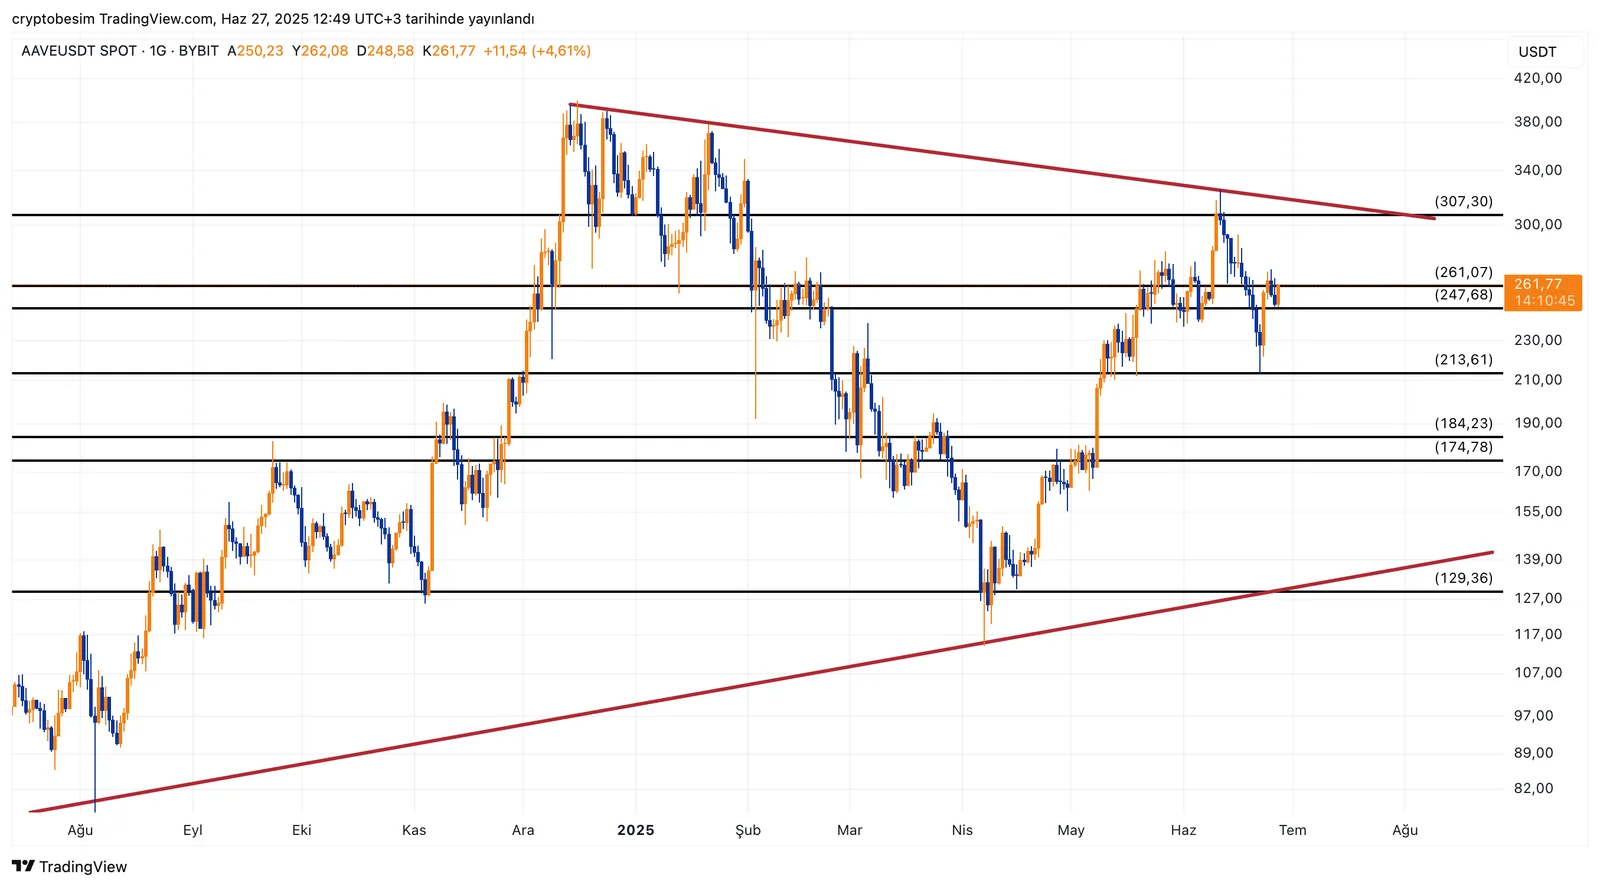
On the chart, the area $247–$261 was an important level, and we witnessed an increase up to the level of $307 after rising above this important area. However, the price could not hold here and pulled back to the $247–$261 support.
Depending on the reaction the price will receive from this support level, the first target could be $307, which is both a trend and horizontal resistance, and then the breakout of this long-term downward trend.
If the price loses $247, this means that the support levels $213 and $184 could be on the table. For now, the important price area is the $247–$261 support zone.
These analyses, not offering any kind of investment advice, focus on support and resistance levels considered to offer trading opportunities in the short and medium term according to the market conditions. However, the user is responsible for their own actions and risk management. Moreover, it is highly recommended to use stop loss (SL) during the transactions.


