FXS Technical Analysis
The Frax protocol has restructured its stablecoin system through a new architectural update called "North Star." This update aims to open the frxUSD stablecoin to broader institutional integrations. In particular, thanks to its decentralized reserve model and harmonized governance system, Frax aims to create a stronger foundation for new partnerships and regulation-friendly integrations. The impact of these developments becomes more meaningful when analyzed alongside the technical outlook.
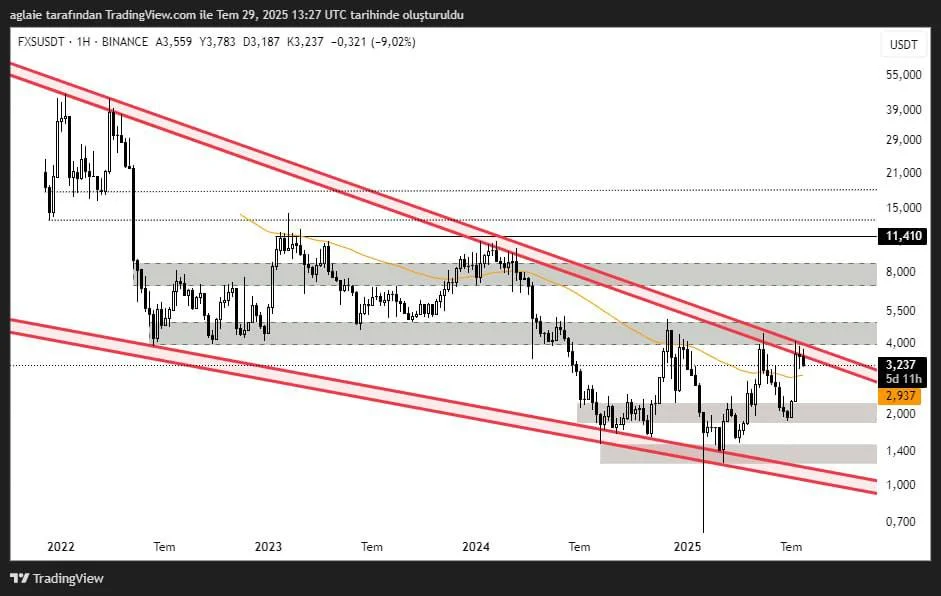
The descending channel pattern in action since 2022 catches our attention when we look at the chart on a daily time frame. The price is trading up and down between the lower and middle borders of this falling channel, with no clear directional confirmation yet. We see that FXS got its latest rejection at the upper border of the channel and then it retreated to the level where MA50 is located. There is a potential two-way possibility for the price: either it will go down and retest, or it will go up for a breakout, which could be more likely if we see increased volume, particularly during the price action near the upper border of the channel.
There is also a great possibility for a sharper price action following the breakout, as this channel has been active for a long period of time—meaning that when the price breaks in one direction, a serious movement area may arise in terms of the continuity of the trend.
Support and Resistance Levels
The first major support area lies at the level of $3.20, which has been tested many times before but defended by buyers. However, if the price breaks downwards, then we will probably see a pullback to the level at $2.93.
On the other hand, if the price can see closings above the level of $3.50, then we could witness a surge to the levels at $3.90 and $5.00, which will confirm the upward breakout of the formation. However, if the price closes below the level of $3.20, then it seems possible to test $2.93 followed by other lower support levels.
These analyses, not offering any kind of investment advice, focus on support and resistance levels considered to offer trading opportunities in the short and medium term according to the market conditions. However, the user is responsible for their own actions and risk management. Moreover, it is highly recommended to use stop loss (SL) during trades.