ZRO Technical Analysis: Downtrend Broken, Now It's Time for Resistance Levels
ZRO has experienced a sharp decline in recent weeks. However, this drop may not only signify weakness but also lay the groundwork for a potential trend reversal. The most crucial recent development on the chart is that the downtrend has been broken. This shift suggests that the downward pressure could be replaced by a more neutral or even upward trajectory.
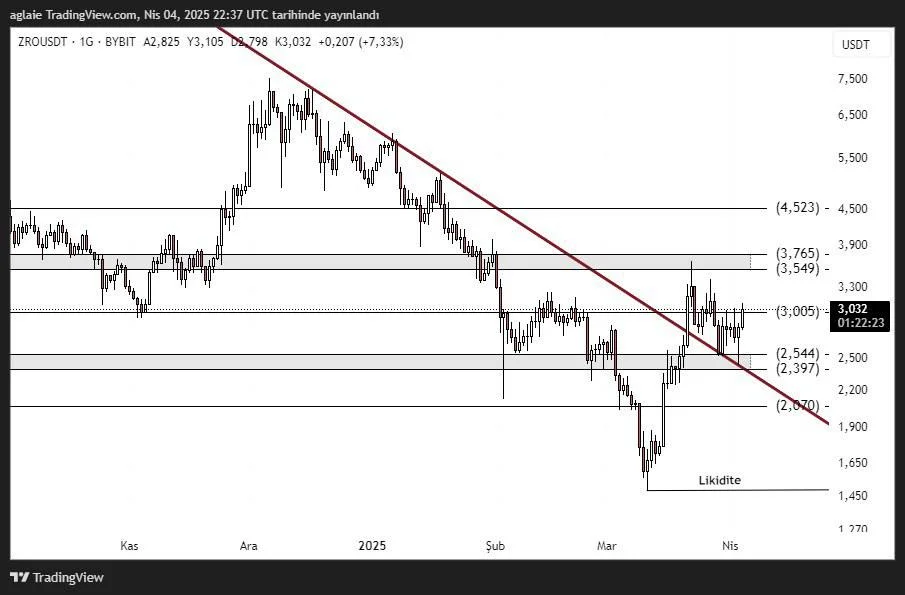
Currently, the price is around 3.032 dollars, a critical technical and psychological threshold. Below this level, the 2.54 – 2.39 dollar range stands out as a key support zone where the broken trend has been retested. This is a classic support-resistance flip.
Support Levels:
- 2.54 – 2.39$ : Retest zone after the trend break – the first area to watch for a reaction
- 2.074$ : Major support – previous bottom of the downtrend
- 1.65 – 1.50$ : Liquidity zone where buyers are concentrated
Resistance Levels:
- 3.005$ : Short-term key resistance – price is currently testing this level
- 3.54 – 3.76$ : Strong mid-term resistance zone – first target after a breakout above 3.00$
- 4.52$ : Major resistance in the long term – the origin of the previous downtrend
The price is now testing the 3.00 dollar resistance. If a daily close occurs above this level, the price could technically rise towards the 3.76 dollar region.
The descending red trendline on the chart was the primary barrier that had been pressuring the price for weeks. Its upward breakout signals a potential shift in market structure. The key question now is whether this breakout will hold. The most important factor is whether the price can maintain support levels after the breakout. So far, this test seems successful.
ZRO is not just searching for direction; it appears to have already chosen one. The broken downtrend has now given way to a structure where Fibonacci resistance levels are being tested.
A confirmed daily close above 3.00 dollars would be the first sign of continued upside movement. If this level is surpassed, targets like 3.76 and 4.52 dollars could come into play. However, if the price falls back below 2.54 dollars, the breakout may be invalidated, leading to renewed downward pressure.
In conclusion, it seems that ZRO has finally left its long-standing downtrend behind. The current market structure resembles a classic reversal scenario, where horizontal resistances are being tested after a trend change. However, for this reversal to be sustained, stability above 3.00 dollars is essential. From a technical perspective, this possibility appears to be gaining strength.
Disclaimer:
This analysis does not constitute investment advice. It focuses on support and resistance levels that may present potential short- to mid-term trading opportunities depending on market conditions. However, all responsibility for trading decisions and risk management lies entirely with the user. The use of stop-loss orders is strongly recommended for any trade setup shared.