
Cetus Protocol (CETUS) Technical Analysis: Approaching a Key Breakout Zone
Cetus Protocol is showing signs of a potential upward move within a long-standing descending channel pattern. Currently, the CETUS/USDT pair is trading at $0.1233, hovering near both the upper boundary of the channel and a key horizontal resistance level—suggesting a possible breakout is on the horizon.
Since January, CETUS has been in a downtrend but has begun to recover from the $0.0788 support zone. A series of consecutive bullish daily closes and the break of lower low formations signal a potential shift in short-term momentum favoring buyers.
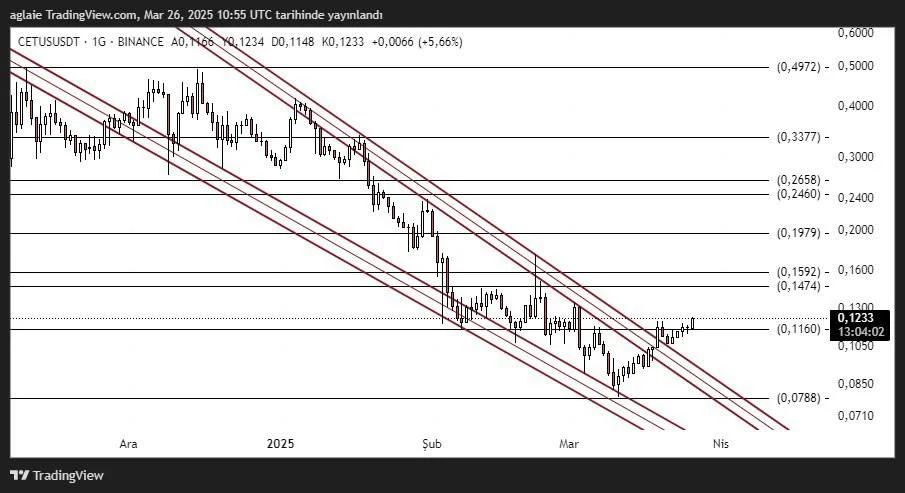
Key Technical Levels for CETUS/USDT
Support Zones:
- $0.1160 – $0.1050 – Channel support zone
- $0.0870 – $0.0788 – Recent bottom levels
Resistance Zones:
- $0.1474 – $0.1592 – First major resistance block
- $0.1979 – Previously tested resistance
- $0.2460 – $0.2658 – Medium-term resistance area
- $0.3377 – $0.4000 – Long-term upside targets
As long as the price holds above $0.1160, the upward potential remains intact. The $0.1474 – $0.1592 zone will be critical in determining the direction of the next major move.
What Happens If the Channel Breaks?
The current narrowing channel structure often precedes sharp moves. Right now, the price is testing the channel’s upper band. A confirmed breakout above this level could spark a swift rally in the short term.
What Should CETUS Traders Watch?
- Daily Close Above $0.1250: A close above this level would confirm a bullish breakout.
- Maintain Key Support: A close below $0.1160 would indicate renewed weakness.
- Staggered Targeting Strategy: Track key resistance levels from $0.1474 up to $0.1979 progressively.
Rather than chasing impulsive moves, traders should wait for confirmed breakouts and set clear stop-loss levels to manage risk effectively.
The First Steps of a Potential CETUS Rally
Cetus Protocol is technically nearing the end of its descending channel structure. Price action and indicators suggest growing potential for a short-term breakout to the upside. If the price manages a daily close above the channel, the first target for the CETUS/USDT pair will be around $0.1474.
The overall outlook is increasingly positive, and the technical structure appears to be gearing up for a potential trend reversal—potentially marking the beginning of a new bullish wave for CETUS.
Disclaimer: This analysis is not financial advice. It is intended solely for informational purposes, focusing on support and resistance zones that could offer short- to medium-term trading opportunities under current market conditions. All trading decisions and risk management are the sole responsibility of the trader. Using stop-loss strategies is strongly recommended.