Worldcoin (WLD) Technical Analysis: The Effort to Hold On to Critical Support
Worldcoin (WLD) continues to be priced in a falling channel movement that has been ongoing since the ATH level it made about 1 year ago. The price is currently located exactly at the lower limit of this channel structure, that is, above a level that we can call the bottom in a technical sense. The current price is at $ 0.708, and this region appears as an important support area both according to the trend line and past price behavior.
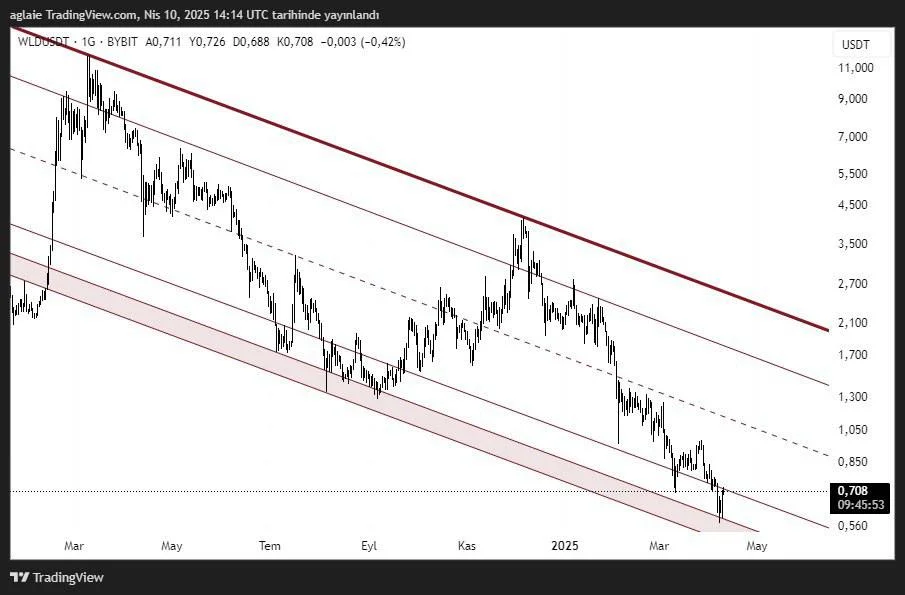
After some positive factors such as positive developments in customs decisions, CPI data, positive opening in US Stock Markets in recent days, the price received a reaction from $ 0.58 to $ 0.70, experiencing a recovery in a short time in the support area that appears in the bottom zone of the channel level, receiving a reaction as it should.
What is noteworthy on the chart is that the price has tested the channel many times and produces reaction movements every time it comes to the lower band. This shows us that the trend structure is still technically working. The current movement may be a classic scenario in which this channel is tested again and a reaction is sought. In this scenario, if it continues to produce similar movements, an upward process may begin to the $ 2.00 levels, which are the upper band of the channel, in the medium term. In this process, the decisions in world finance and the FED's May interest rate decision will be very influential.
FED Rate Cut, steps back on Customs Duties, etc. with such decisions, there will be high amounts of money inflow to High-Risk Investment Instruments. One of the coins that will benefit the most from this money entry, WLD, which is the representative of the Artificial Intelligence hype in crypto that started with Nvidia, will get a big share of this pie. Worldcoin, which has moved to the upper channel of the falling trend with these positive developments, can break this trend and turn the falling trend formation into a rising trend and be an opportunity for us to start a new ATH journey.
Medium-Long-Term Support and Resistance Zones
Support Levels:
- $0.680 – $0.700: Channel subband, current retention zone
- 0.560 – 0.600$: The next support line to follow if a sub-breakage occurs
- $0.480 and below: Oversold zone – major risk level
Resistance Levels:
- $0.850 – $0.950: The first recovery target
- $1,300: Midband - significant resistance to intra-channel upward movement
- $1,700: Strong resistance to break for above channel
- $ 2,700+: Long-term target region – the upper band of the channel
After examining the long-term support-resistances, the position of the trend structure, possible scenarios, let's look at where we are in the short-term now.
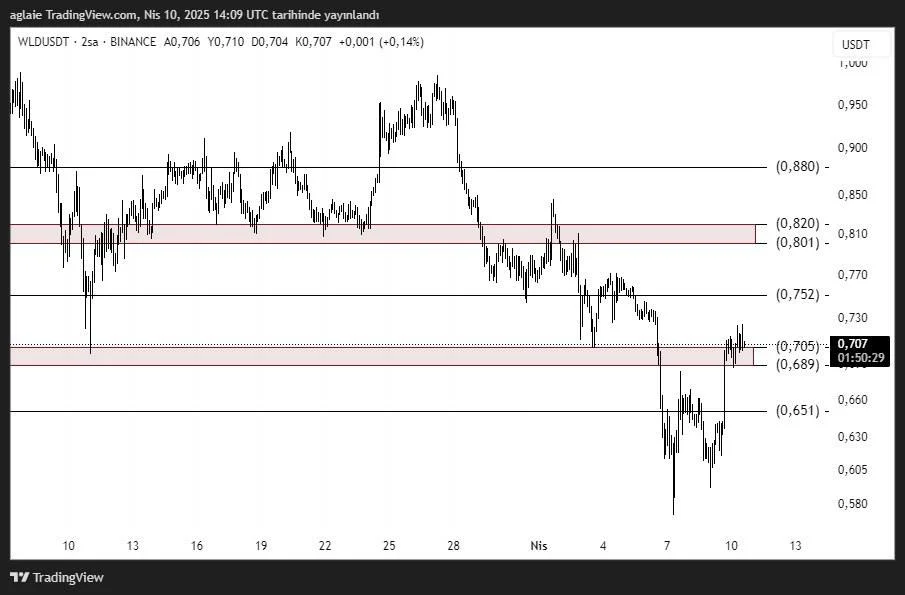
As we saw on the chart, after receiving a reaction from the lower channel of the long-term falling trend, the price has reached this point with a rapid recovery process, has turned the $0.689-0.705$ channel, which often works as a support during the month, breaks and turns into resistance during the last decline, breaking upward again and turning into a support position. With the persistence above this point, the $0.80 level will be the first short-term target with positive developments in the market. After a short correction of $ 0.75 from this point, it can make a break by testing the resistance of $ 0.80 again along with a voluminous purchase request. With this breakdown, the short-term negative market structure will turn positive with the MSB at 0.85.
After this turn, the short-term momentum may increase and we may see volume increases until the resistance of the long-term falling trend. The short-term negative scenario will be the scenario in which the price wants to go down again at the closures below $ 0.69 after the fake-break and wants to collect the liquidity left in the region where it made the last dip.
Short-Term Support and Resistance Levels
Support Zones:
0.705 – 0.689 $: Instant support line - the price is just above this zone
$0.651: The bottom zone of the recent decline
$0.600 – $0.580: Extreme correction zone
Resistance Zones:
$0.752: Resistance likely to be tested in the short term
0.801 – 0.820 $: Bulky resistance area - breaking brings strong buying
$0.880: The peak where sales were concentrated earlier
As a result, Worldcoin is currently located at the exact lower limit of the falling channel. This means to us that the price will either start a new downward wave or it can move into a strong recovery process from here. The technical outlook shows that the canal structure is still working and the ground is being prepared for a possible return. Now the eyes are on the buyers. If this region is protected, a hopeful story can be written for the WLD again.
These analyses, which do not offer investment advice, focus on support and resistance levels that are thought to create trading opportunities in the short and medium term according to market conditions. However, the responsibility for making transactions and risk management belongs entirely to the user. In addition, it is strongly recommended to use stop loss in relation to shared transactions.


