PENGU Technical Analysis
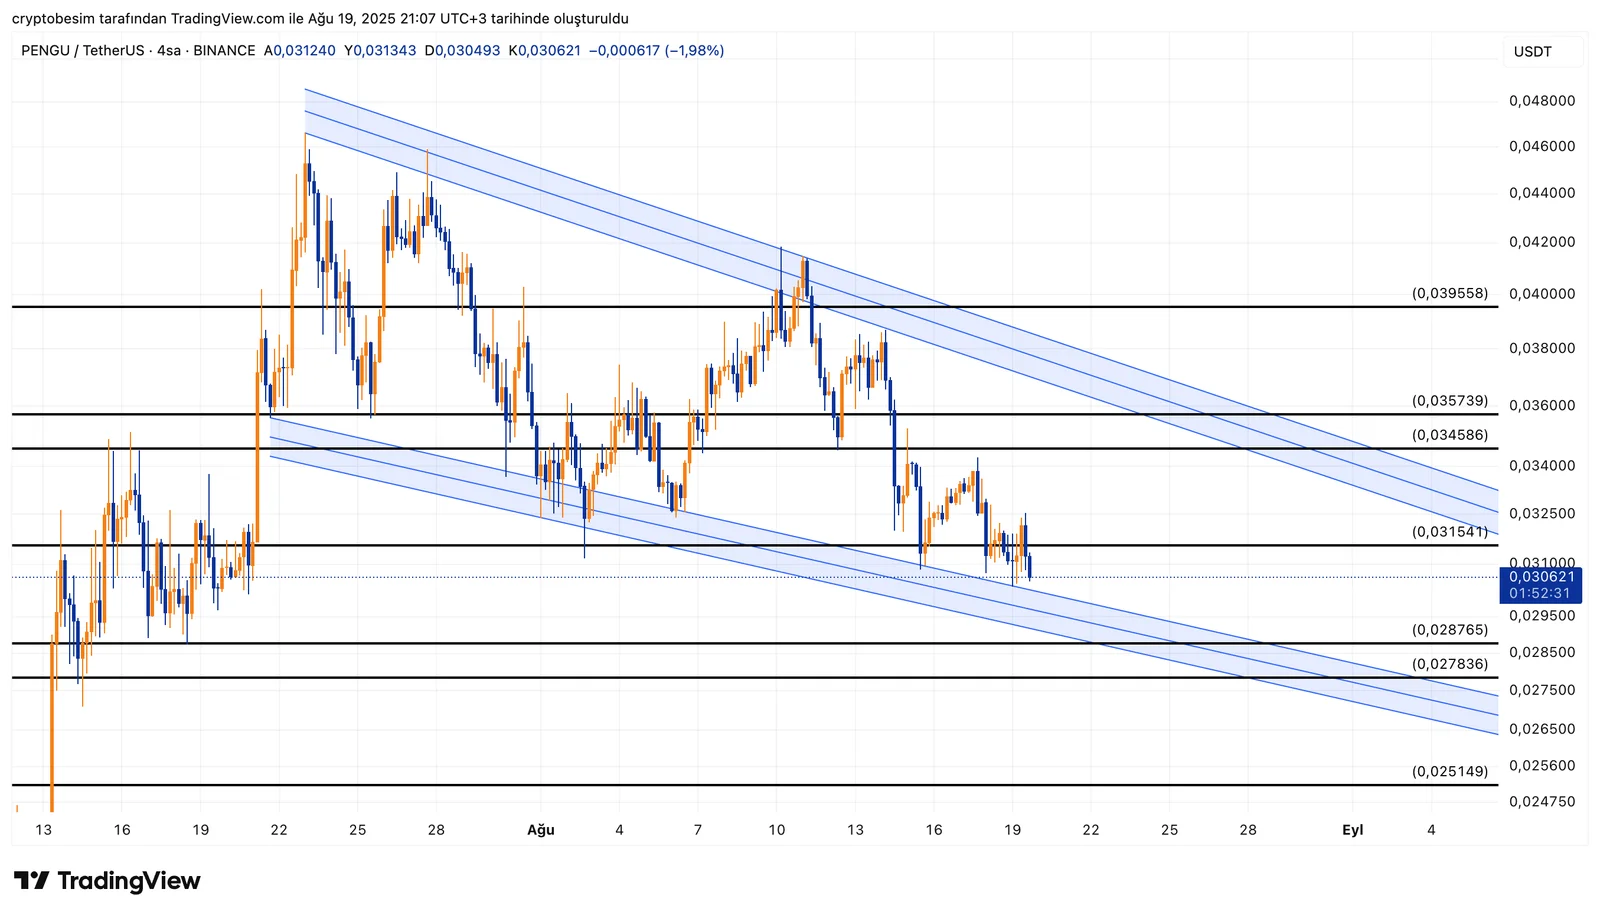
Analyzing Pengu chart, we can clearly see that the price of the coin has been trading within a falling wedge formation for some time. The potential to break above is high according to this wedge formation, so it is technically quite positive.Pengu is close to the lower border of this falling wedge formation and is currently trading around the level at $0.0306, which also intersects the horizontal support range at $0.0287 – $0.0290. Therefore, this range can be considered a key reversal zone.The price will meet the first resistance level at $0.0315 in case of a positive scenario. Above this resistance, the levels at $0.0345 and $0.0357 should be followed as resistance areas that intersect the upper border of the wedge. The price could swiftly surge to the level at $0.0395 if the wedge formation breaks upwards.The levels at $0.0278 and $0.0251 should be followed in case Pengu breaks below the current support levels. However, remember that the primary scenario is an upward breakout as long as the formation holds.

- SummaryFormation: Falling wedgePrice: $0.0306Key support levels: $0.0287 – $0.0290 and $0.0278Upper targets: $0.0315 → $0.0345 → $0.0357 → $0.0395Main scenario: Falling wedge formation could break above if Pengu can hold above the current support level.
These analyses, not offering any kind of investment advice, focus on support and resistance levels considered to offer trading opportunities in the short and medium term according to the market conditions. However, traders are responsible for their own actions and risk management. Moreover, it is highly recommended to use stop loss (SL) during trades.


