ETHFI/USDT Technical Analysis
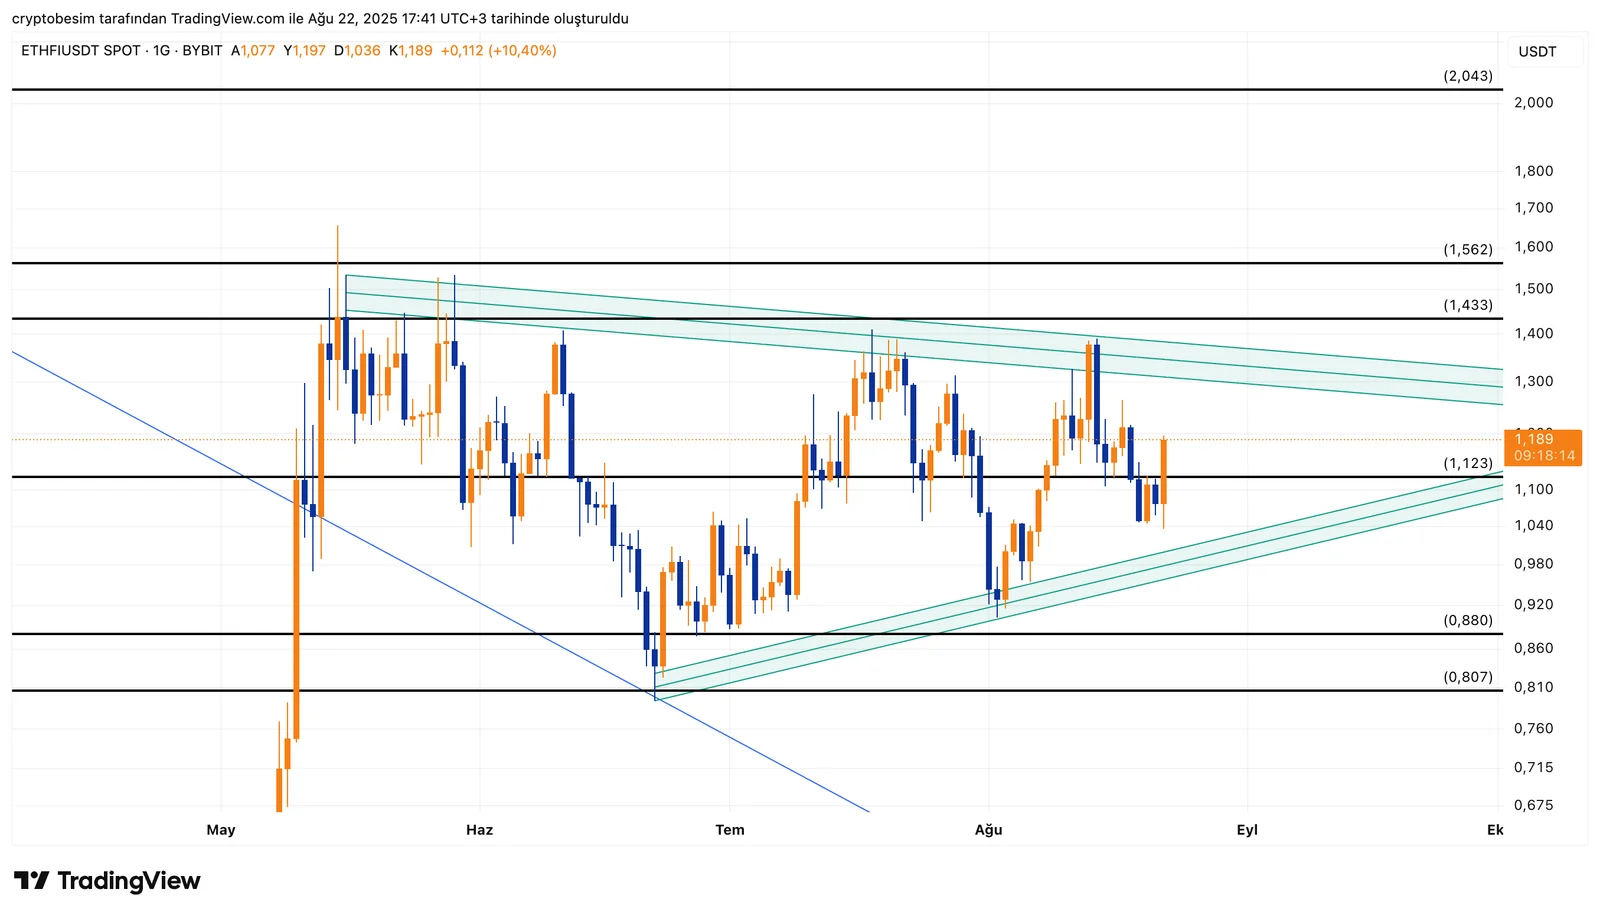
There is a standing symmetrical triangle formation on the ETHFI chart, yet the price has slipped below the support level, suggesting that the bearish scenario has strengthened.The current price is hovering around $1.31. Since the mid-band of the formation at $1.12 has been broken to the downside, this level has now turned into a resistance zone. Following this breakdown, the first trend support stands at $1.09, while more critical horizontal levels are seen at $0.95 and $0.88. If these areas fail to hold, we could see a deeper move toward the $0.80 range.On the upside, a recovery would require the price to climb back above $1.12. Without sustainable consolidation above this level, upward moves will remain weak. However, in the case of a strong reversal, targets at $1.35 – $1.43, followed by $1.56 and $2.05, could come back into play.

Summary
- Formation: Triangle Formation
- Key resistance: $1.12
- Support levels: $1.09 → $0.95 → $0.88 → $0.80
- Upper targets: $1.35 → $1.56 → $2.05


