
ARB
ARB Coin is trying to hold its ground near the $0.2958 support level within a descending channel. In this analysis, we take a detailed look at critical resistance zones and possible scenarios.
After forming a peak, Arbitrum (ARB) entered a long-term downtrend. Currently, the price is trading around $0.3662, close to the upper boundary of the descending channel. After touching the lower boundary of the channel, the price has seen a reaction. Additionally, the slight recovery from the $0.29 level suggests that this zone is attracting buyer interest.
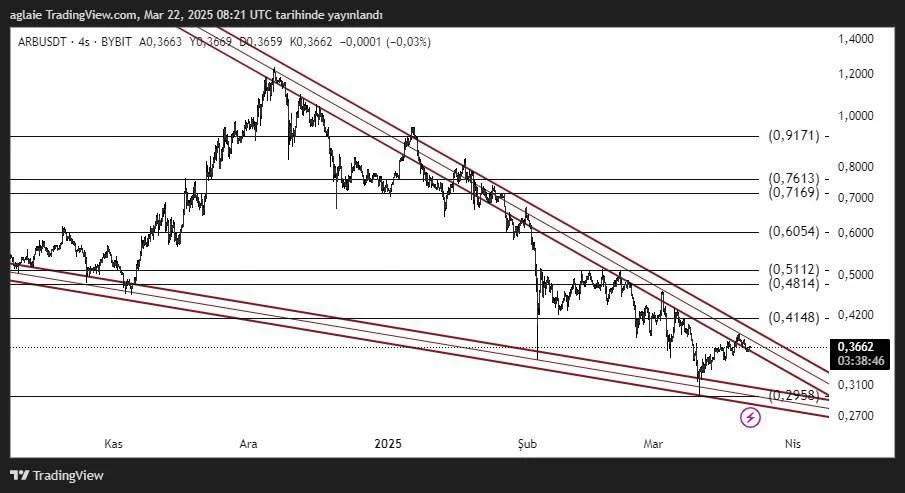
The strongest support level is found at $0.2958. This level serves as both a psychological and technical defense zone. If the price remains below this level, it may decline toward $0.27, increasing the risk of breaking below the channel structure.
In a bullish scenario, the first major resistance level is at $0.4148. This area has been tested several times previously but failed to hold as support. If the price can close above this level, the next targets would be $0.4812, $0.5112, and $0.6054. Particularly, a sustained move above $0.6054 would indicate a breakout from the descending channel and could be seen as a potential trend reversal signal.
Another key zone is the $0.7169 – $0.7613 range. This region could act as a strong medium-term resistance and may determine the longer-term direction. If this band is broken, investor confidence might be restored, pushing the price toward the psychological resistance at $1.00.
Key technical levels for ARB Coin:
• Support levels: $0.2958 – $0.2700
• Resistance levels: $0.4148 – $0.5112 – $0.6054 – $0.7169 – $0.7613
In summary, although ARB Coin is still trading within a strong descending channel, the recent reaction from the lower boundary and the flattening of price action suggest a potential short-term direction shift. The key level to watch in the coming days is the $0.4148 resistance. A break above this level could trigger an upward movement. However, if selling pressure resumes from this zone, the price might once again head toward the lower boundary of the channel.
This analysis does not constitute investment advice. It focuses on support and resistance levels that may present potential short- to mid-term trading opportunities depending on market conditions. However, all responsibility for trading decisions and risk management lies entirely with the user. The use of stop-loss orders is strongly recommended for any trade setup shared.
Author: Ilahe